
Buyers on the Nifty turn thrifty

Key points:
- The Nifty 50 index of large Indian stocks has suffered severe and widespread selling pressure after a momentum run
- Several breadth indicators are at distressed levels, showing modest panic within a long-term uptrend
- Similar pullbacks have tended to see the uptrend resume soon, with rallies tending to last 1-3 months
Weeks of widespread selling
For a while, Indian stocks were all the rage. But, like most things, gravity eventually catches up to some degree. Investors got a bit tired of the trade, especially when there was a shiny new object (China, for a while).
Selling over the last couple of weeks in the 50 largest companies on the National Stock Exchange has been relatively severe, especially so soon after the Nifty 50 hit new highs.
Over the past two weeks, about 11 more stocks have declined than rallied on an average day. That doesn't sound like much, but it's a lot in an index with only 50 members. It's the 2nd-most severe selling pressure in four years.
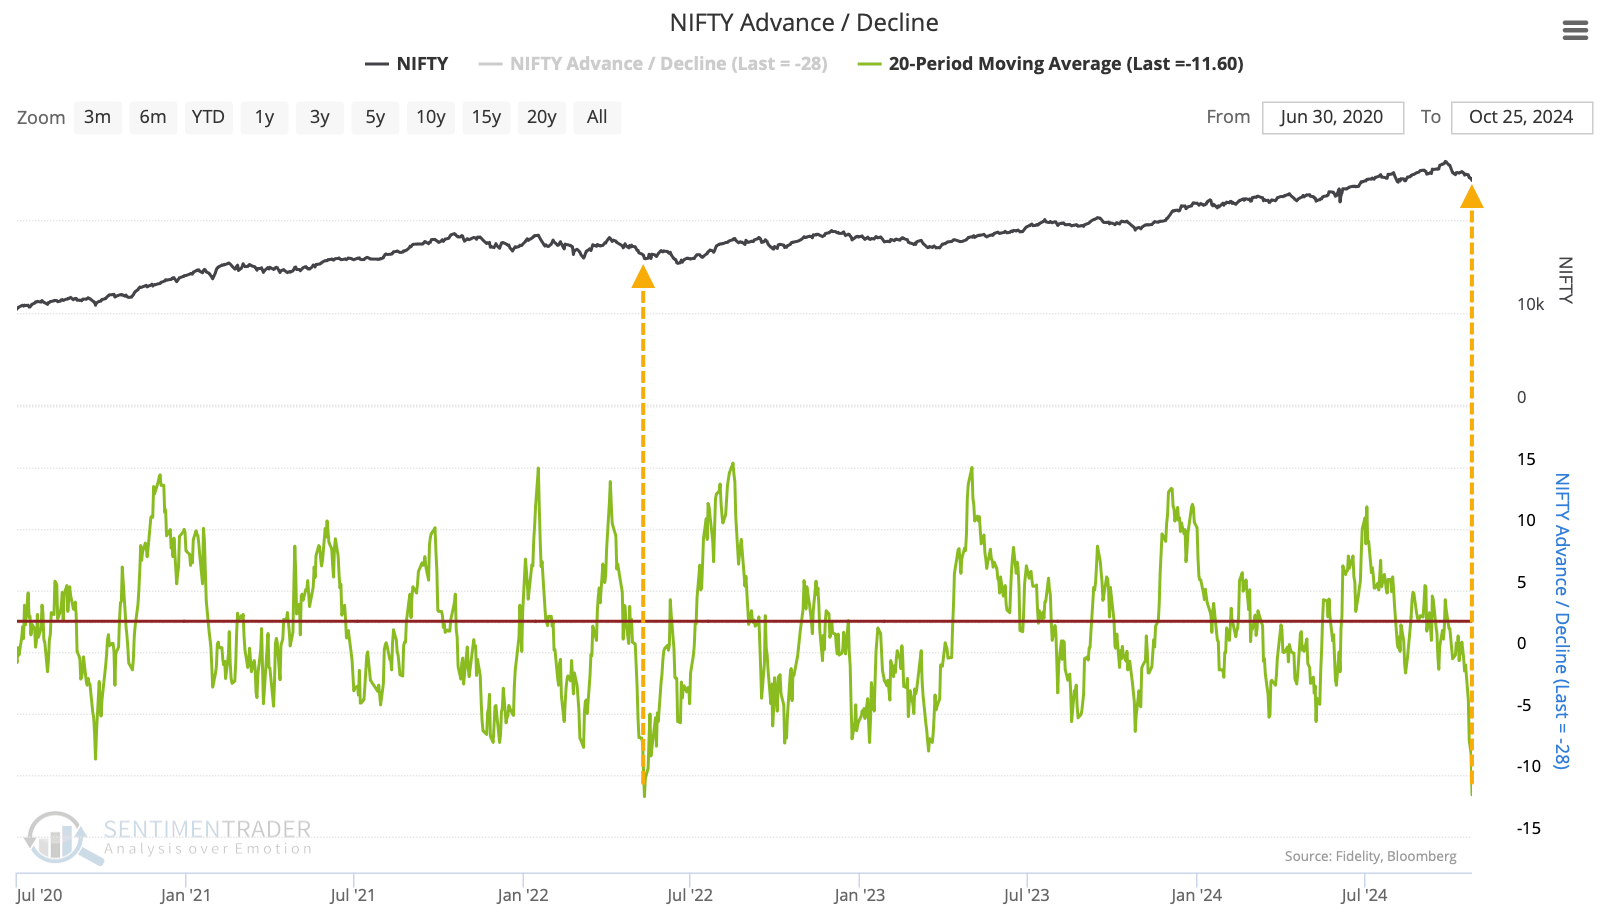
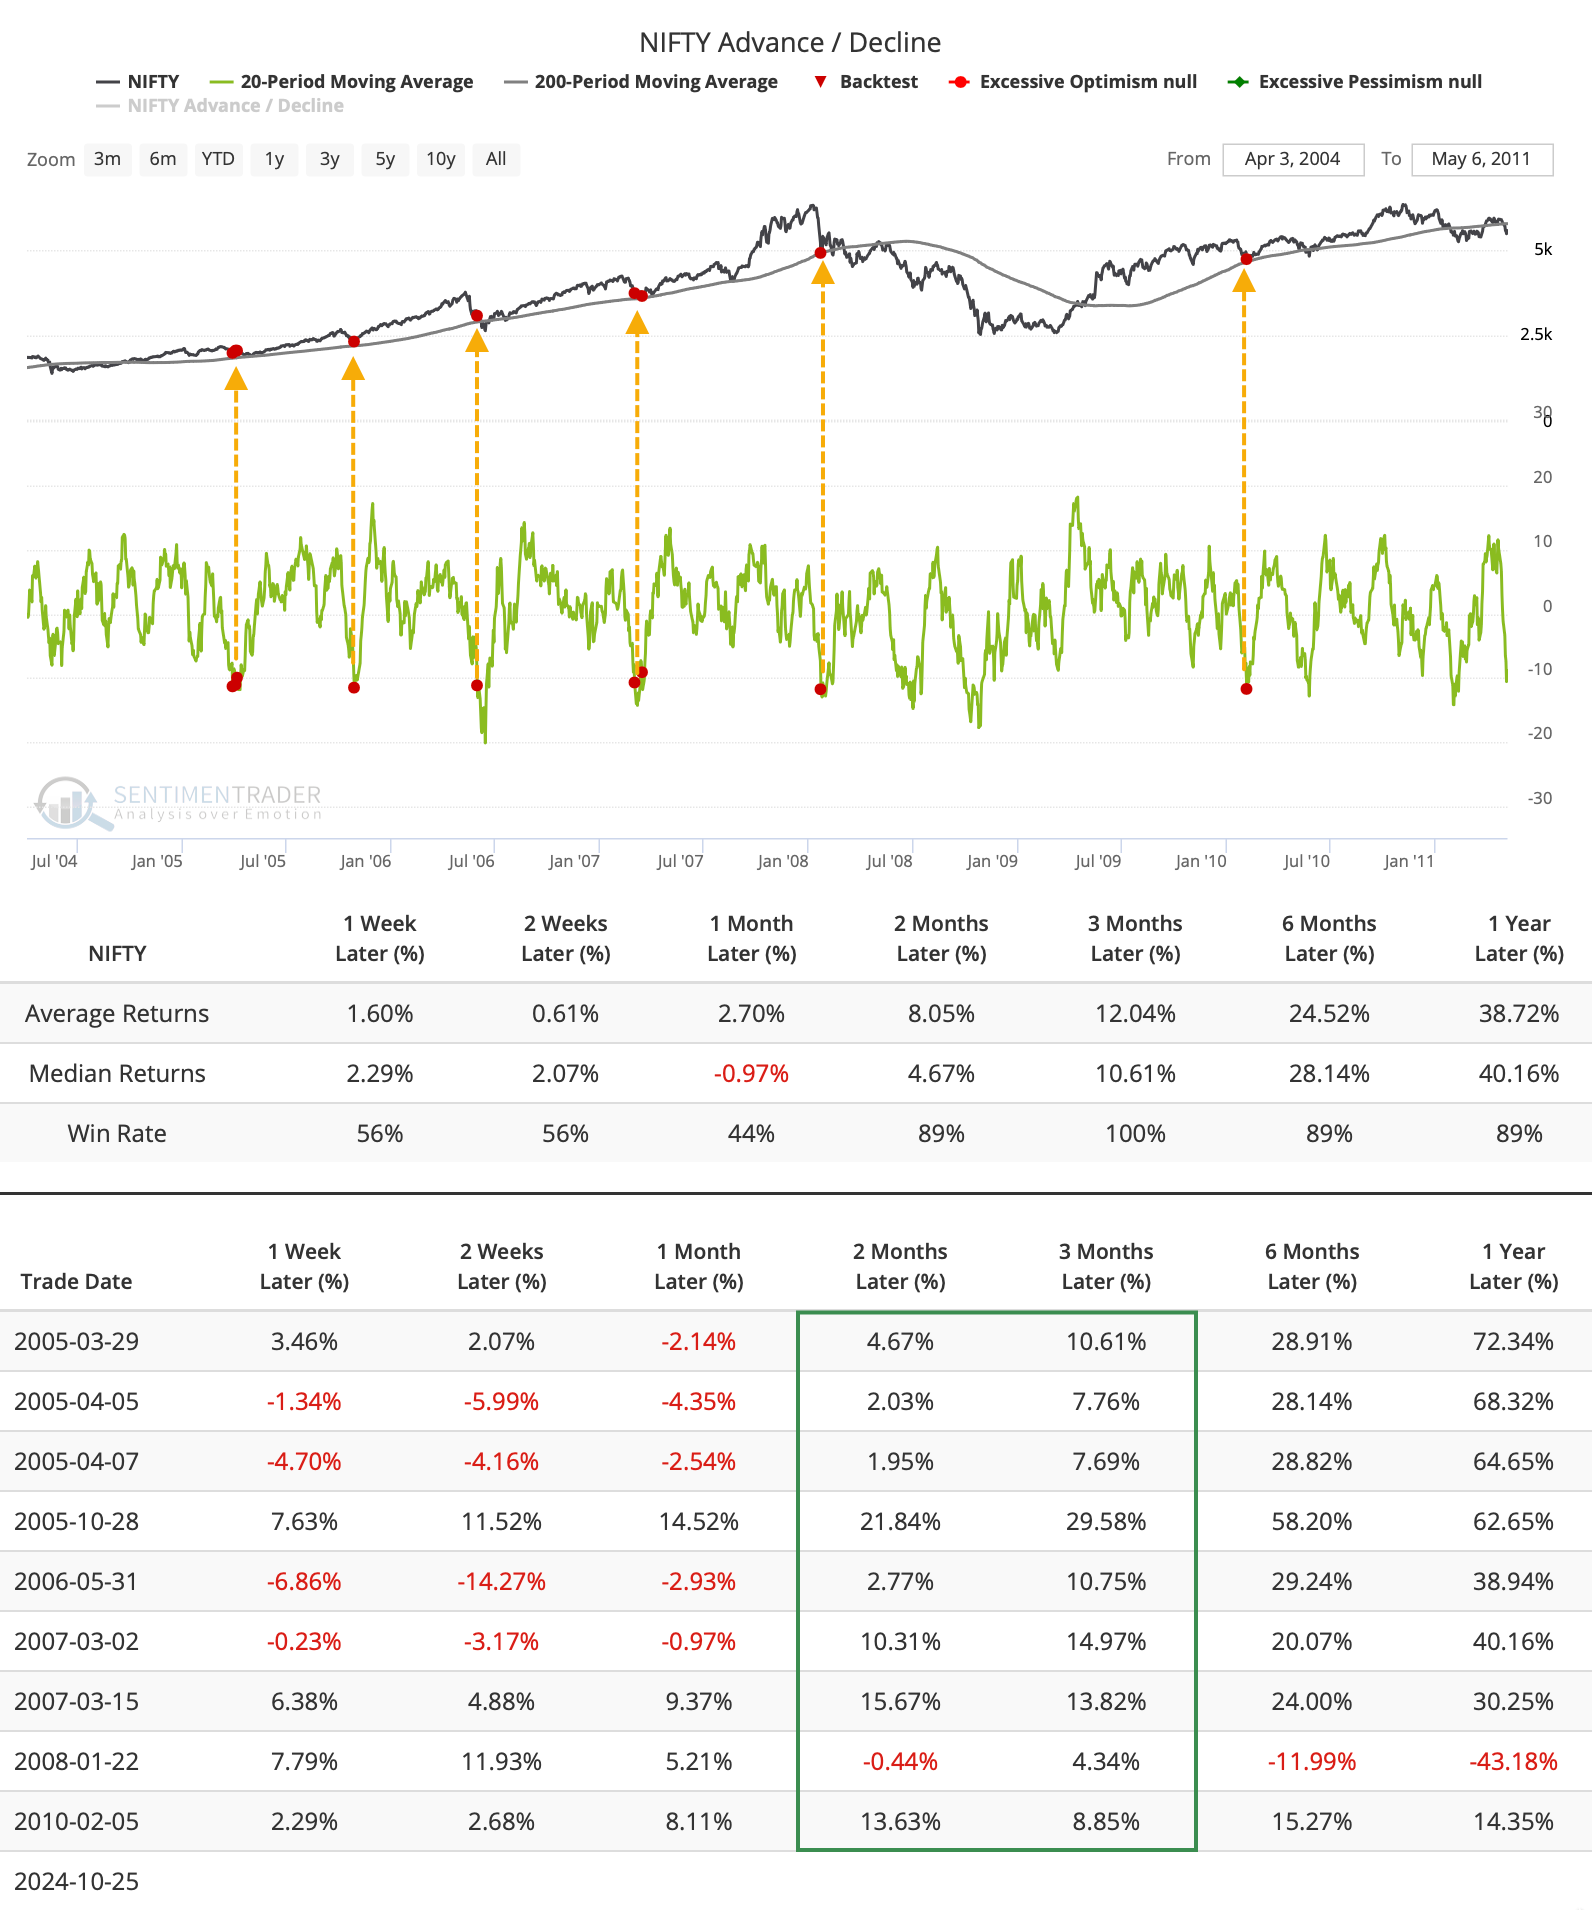
That other instance, in May 2022, nearly marked the low for the Nifty. It was also a somewhat different context since the index was trading below its 200-day moving average at the time, while it's still above that long-term trendline now. Over the past 25 years, there have only been a handful of days with such severe multi-week selling during long-term uptrends. Each saw the Nifty 50 resume its rally over the next 2-3 months.
The first real pullback after a momentum run
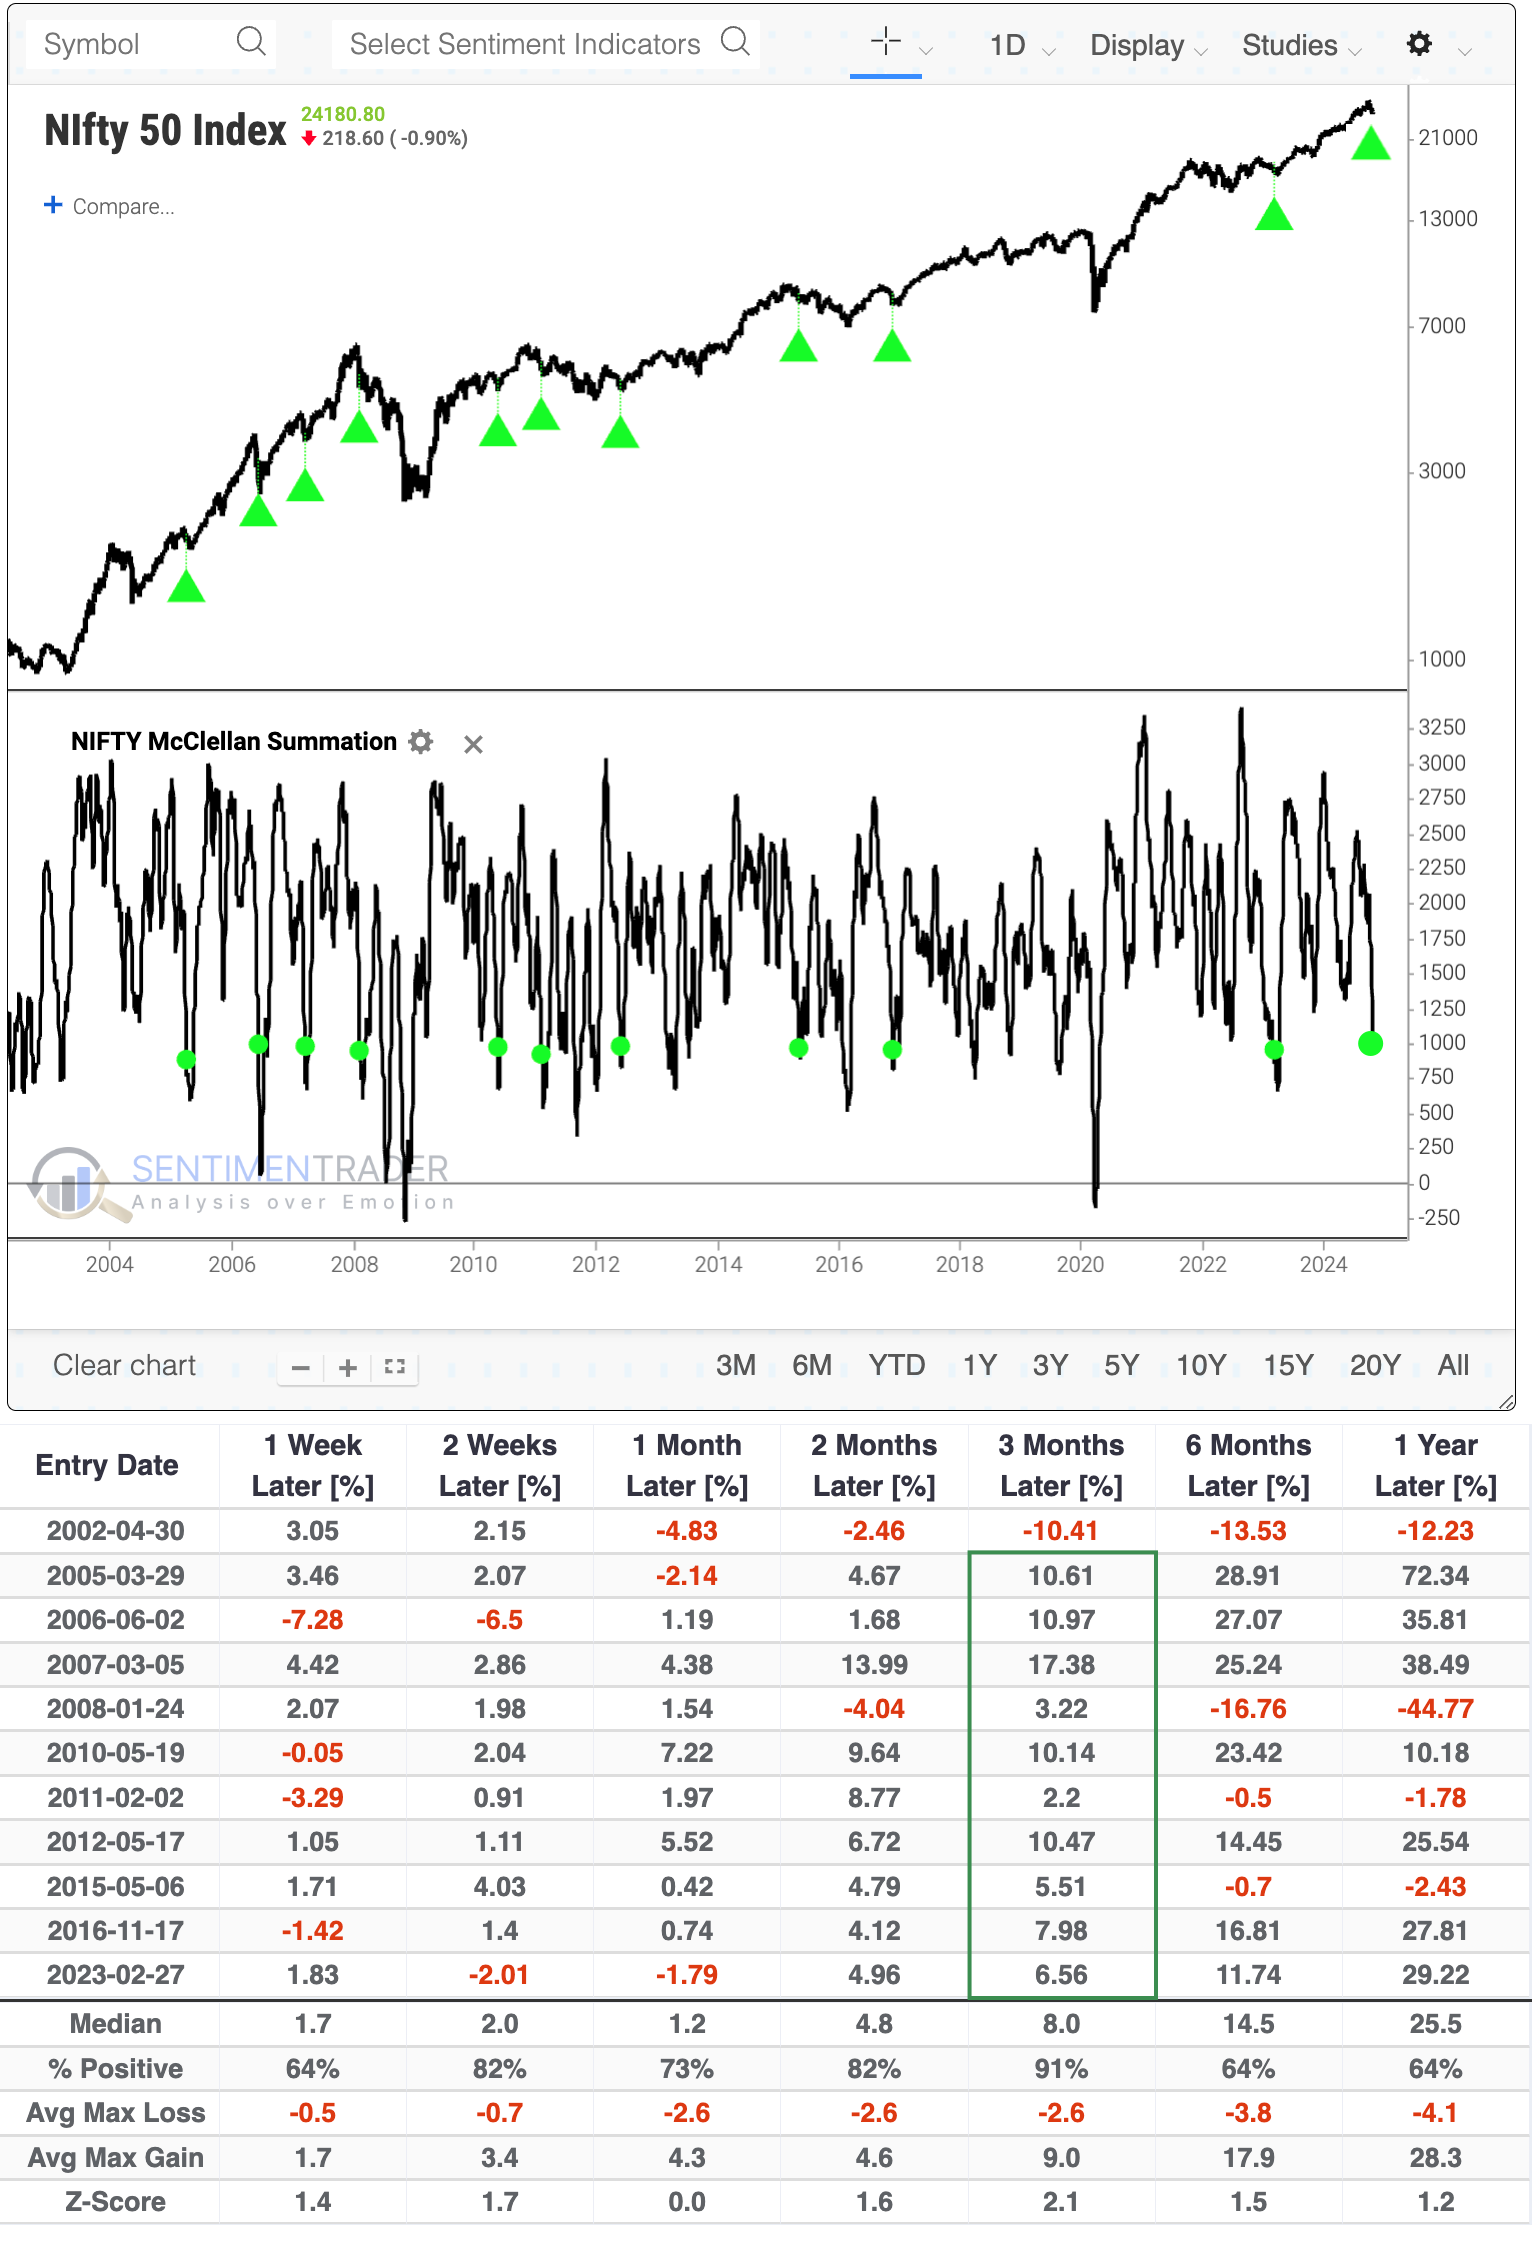
The selling pressure has caused the long-term McClellan Summation Index for the Nifty to fall precipitously in recent weeks. It has declined to +1,000 for only the third time since it began its post-pandemic run. The other two marked the best risk/reward opportunities for investors during this stretch.
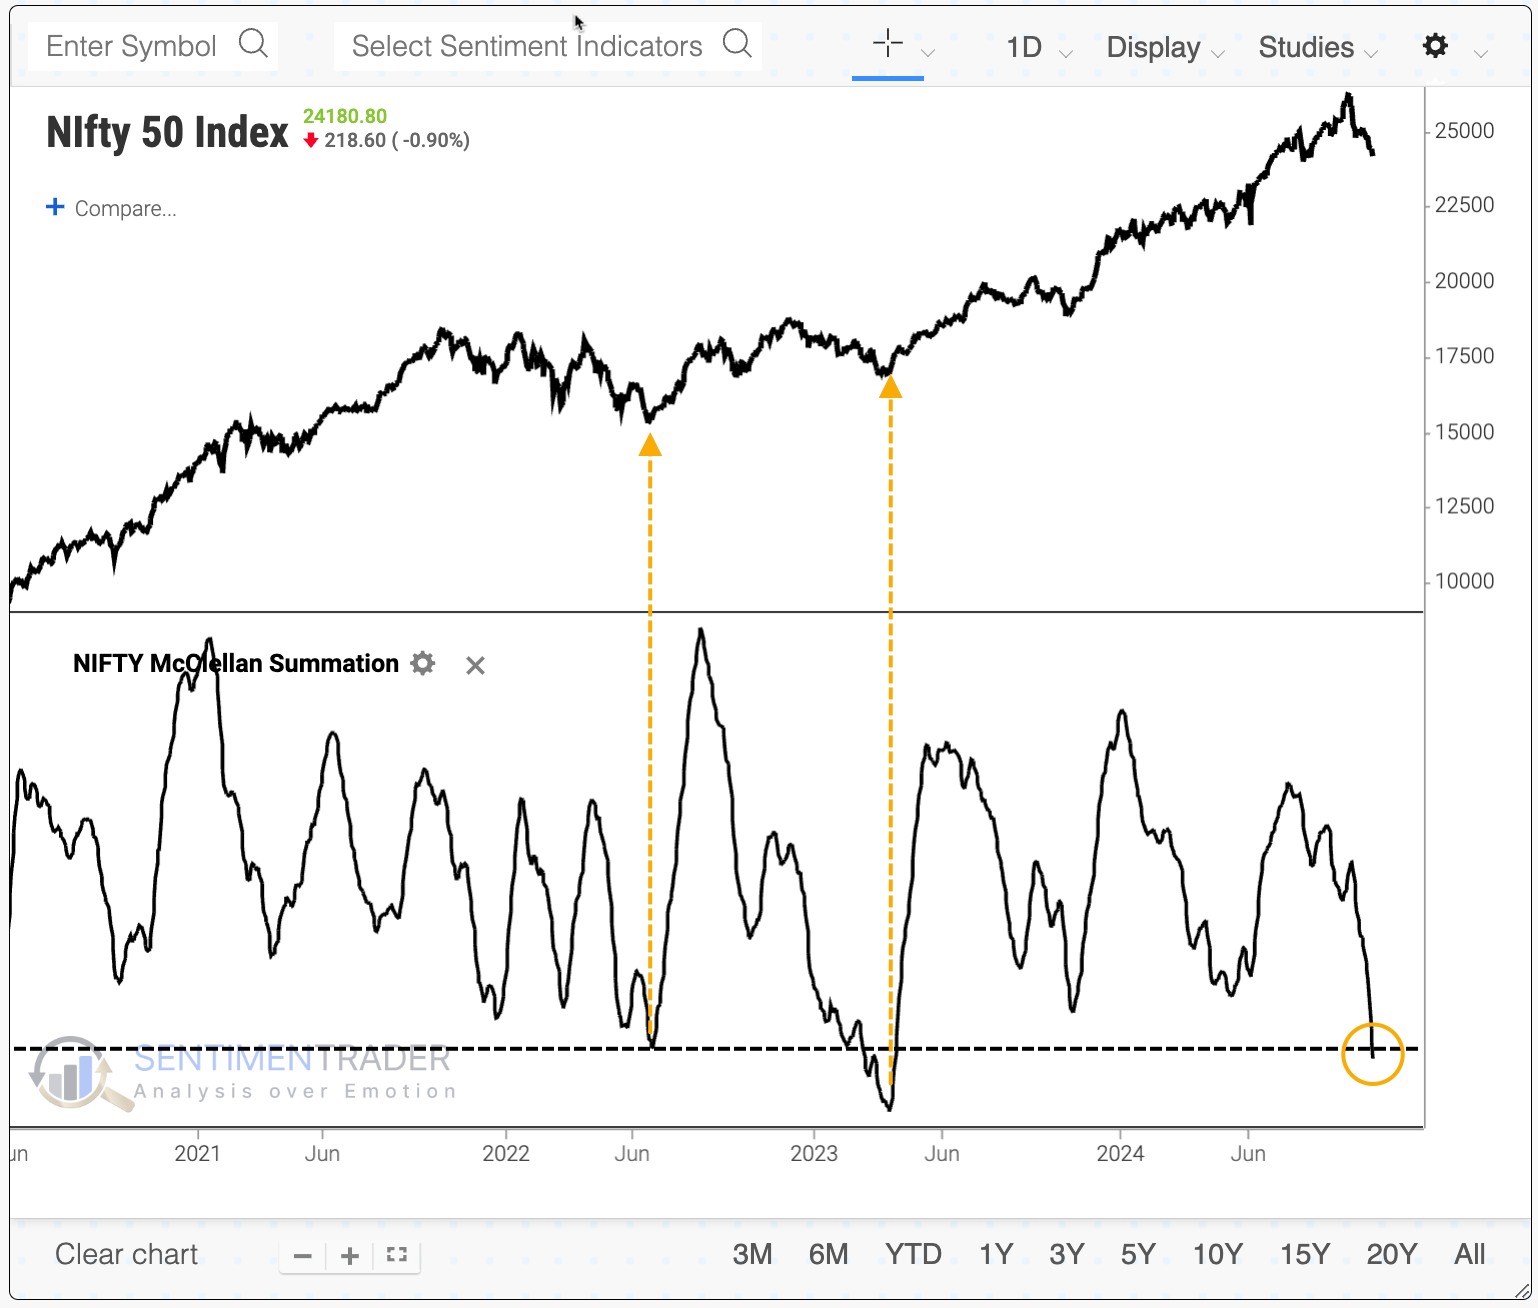
We like to get context by looking at cycles in indicators, when they travel from one threshold to another. The Nifty's Summation Index had enough momentum to exceed +2,500 before returning to neutral territory. Similar cycles preceded further gains almost without exception.
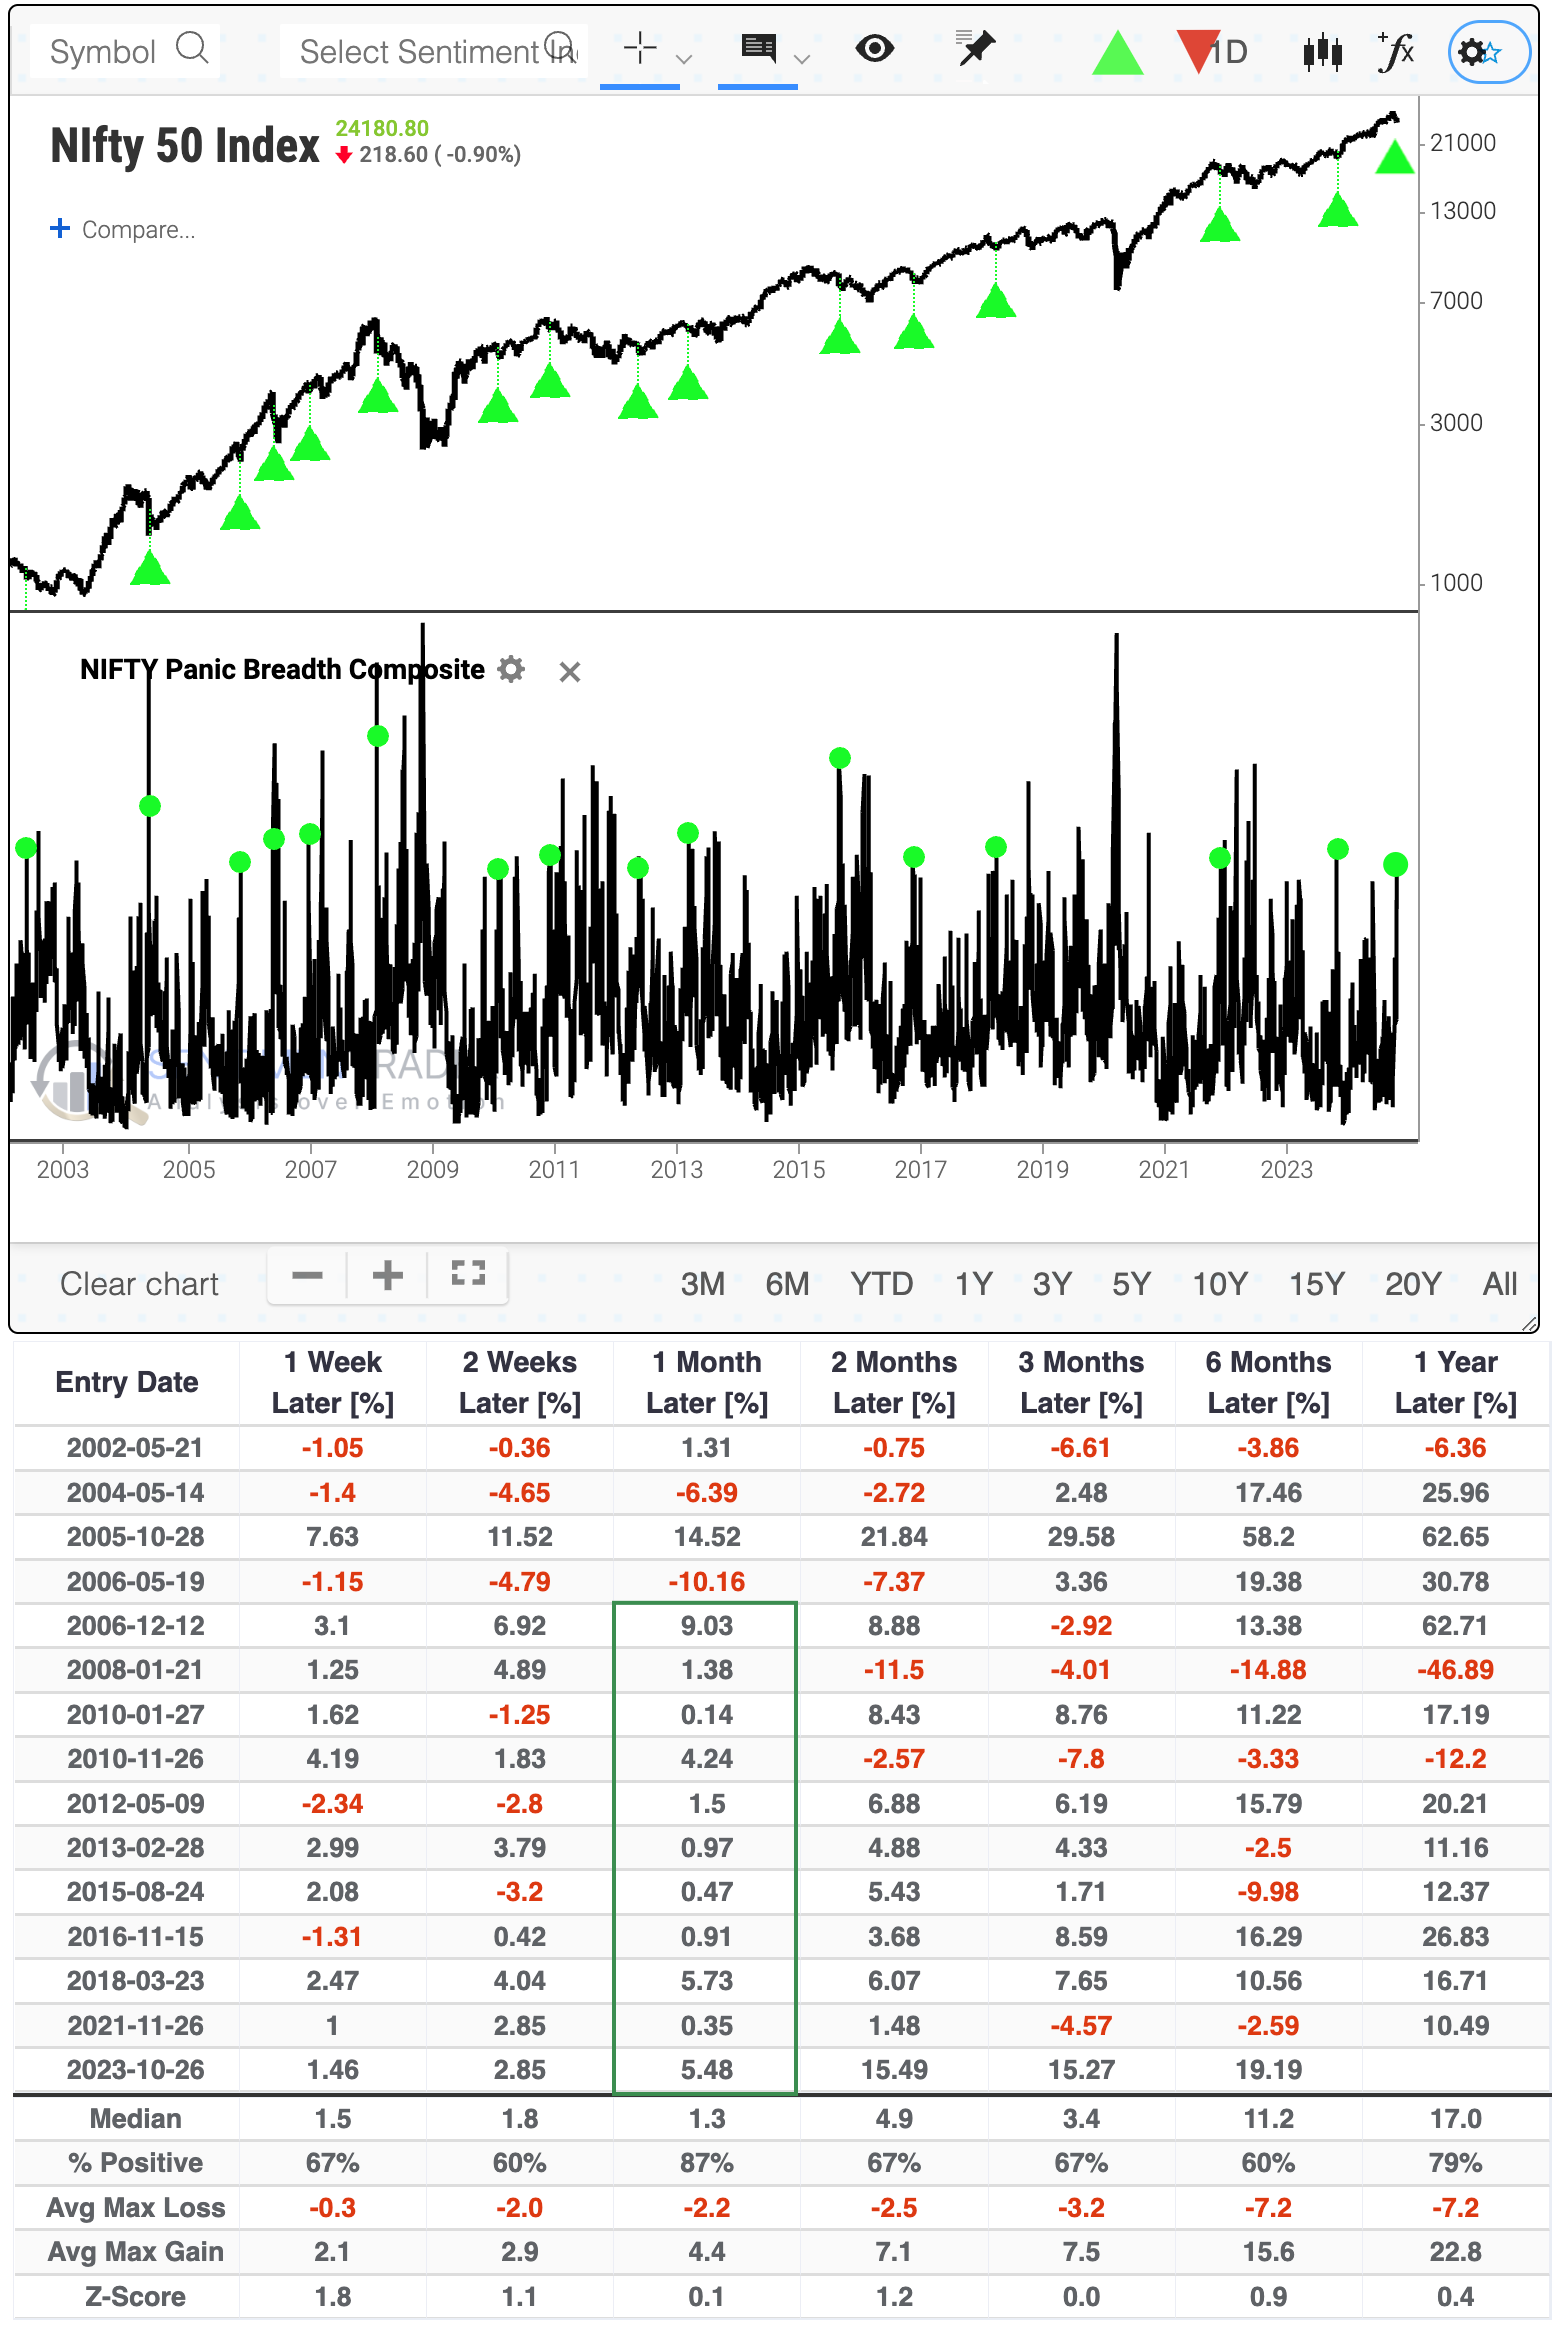
The jump in breadth indicators showing widespread and severe selling pressure has caused the Panic Breadth Composite to spike to 45 from what had recently been under 5. The last 11 times it cycled like this, the Nifty rallied over the next month. All 15 signals sported a positive return either one or three months later.
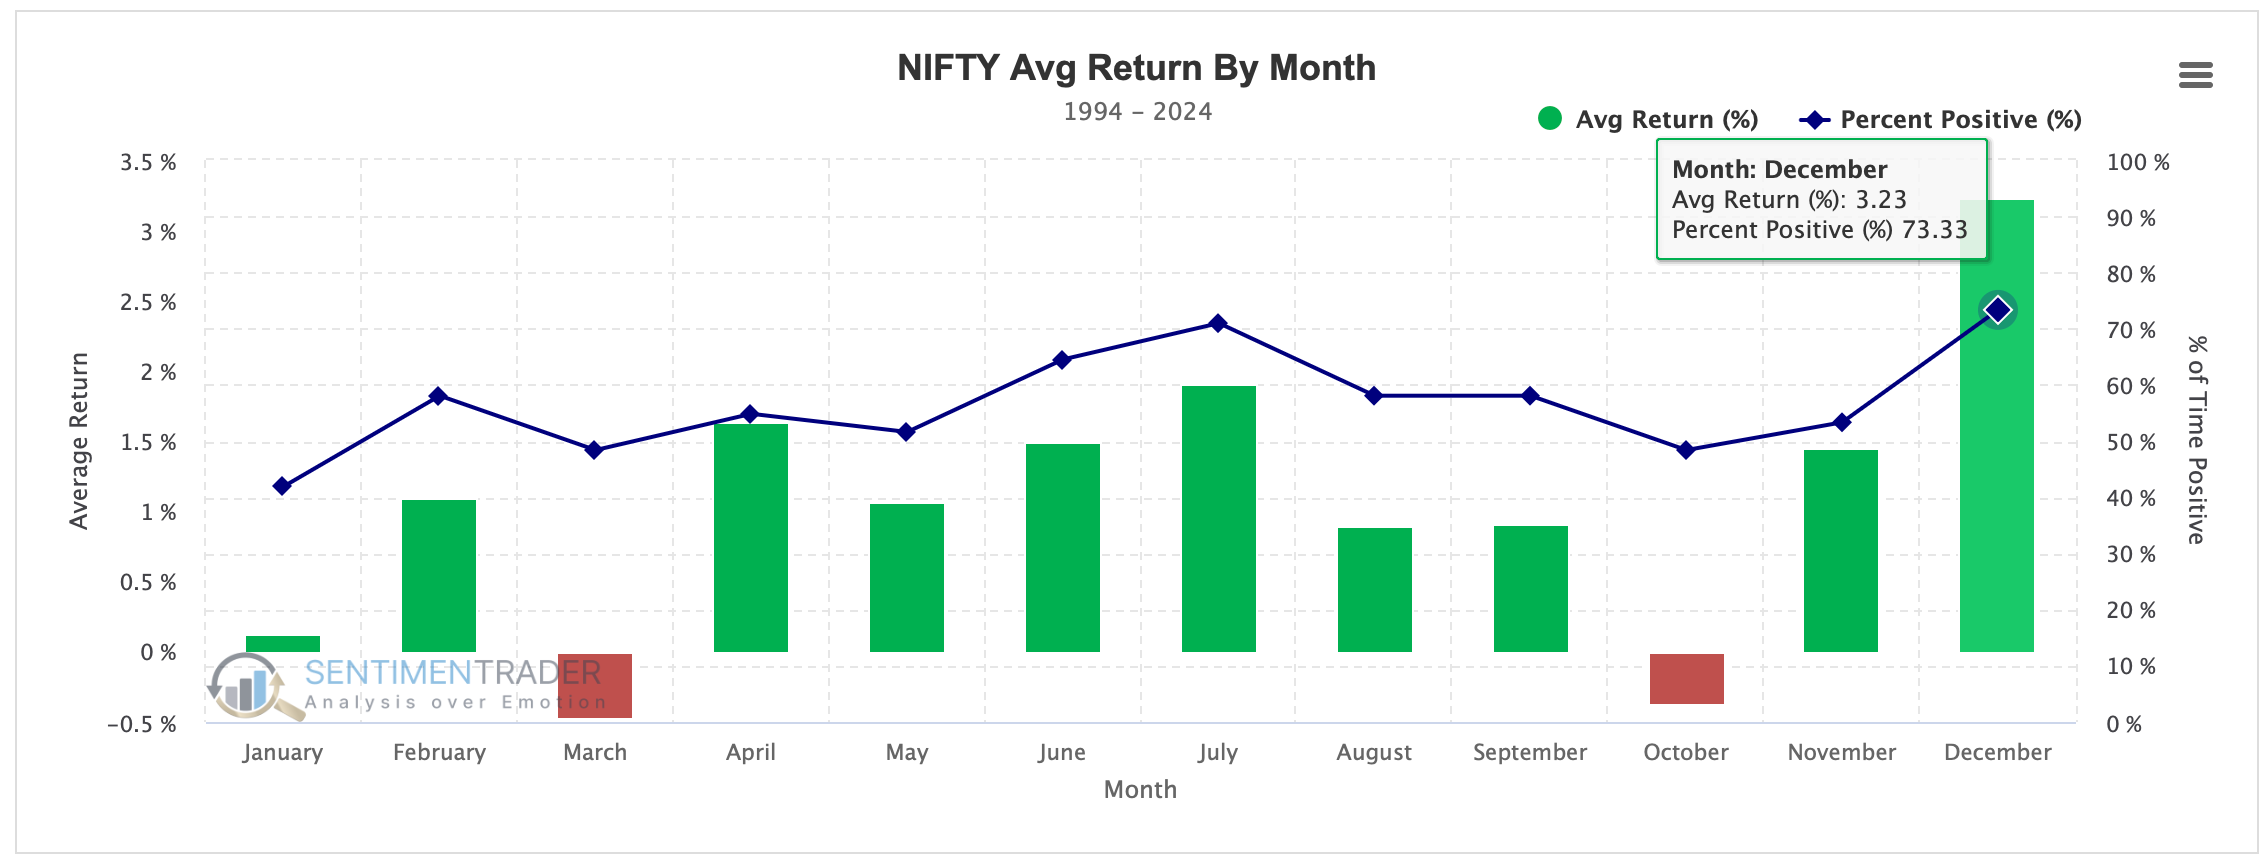
This would be a good time of the year for the index to rally. Over the past 30 years, the Nifty 50 has done well in November and (especially) December, with the latter being the most consistently positive month with by far the best average return.
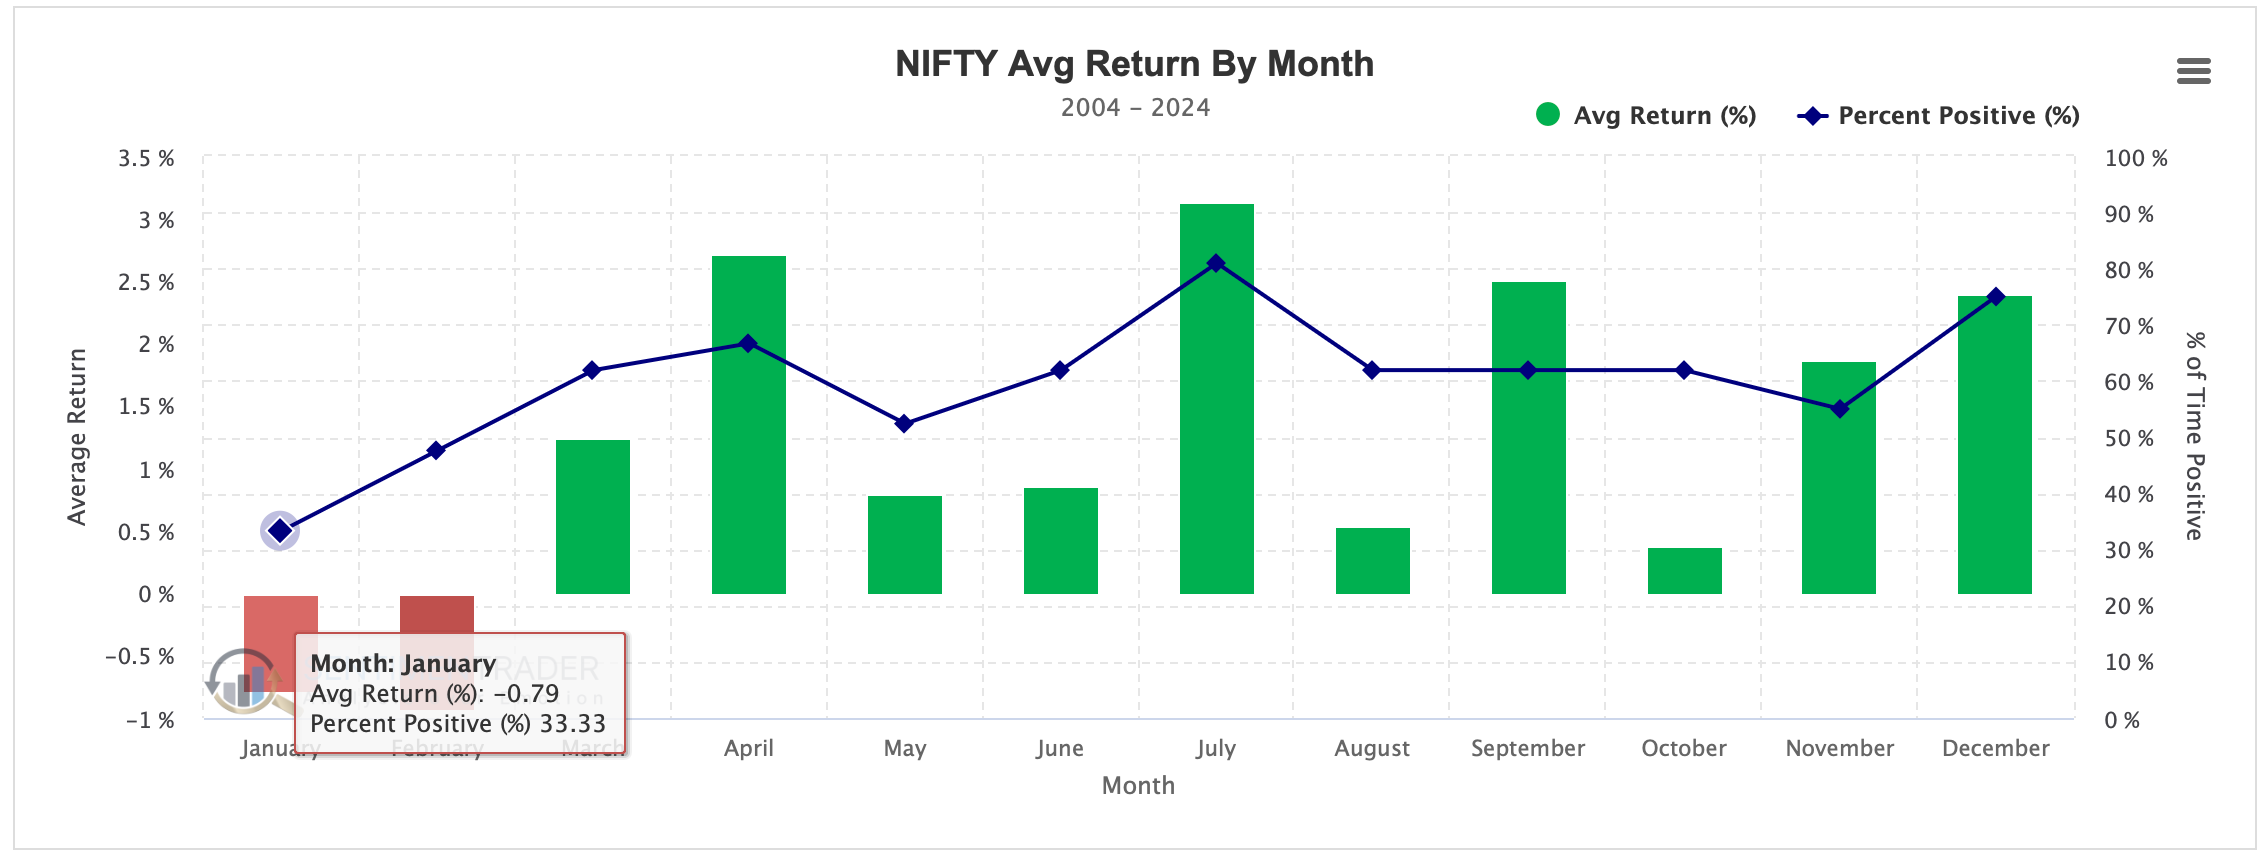
The beginning months of the year have been less kind. Over the past 20 years, January has been positive only 33% of the time.
What the research tells us...
When a momentum trade suffers its first real pullback, there tends to be a ready group of buyers who missed the meat of the move and see their opportunity to get in. Not all markets behave this way, but most broad stock market indices do. It's less consistent for overseas indices than for domestic ones, but it's still a fairly reliable phenomenon.
For quite a while, Indian stocks were the talk of the town until investors' attention got directed elsewhere. Not much has changed fundamentally; it's mostly a sentiment shift. Historically, a pullback like this has been temporary, and buyers have returned. For the Nifty 50, this would be a good time for a repeat, as seasonality is compelling for the next couple of months, which is roughly the sweet spot for trend-continuation signals after a widespread pullback like the stocks have suffered in recent weeks.