Data &
Technology
Research
Reports
Report Solutions
Reports Library
Actionable
Strategies
Free
Resources
Simple Backtest Calculator
Simple Seasonality Calculator
The Kelly Criterion Calculator
Sentiment Geo Map
Public Research Reports
Free Webinar
Pricing
Company
About
Meet Our Team
In the News
Testimonials
Client Success Stories
Contact
Log inLoginSign up
< BACK TO ALL REPORTS

Buyers come back in force yet again, nearing a record year

Jason Goepfert
2020-10-08
Buying interest was enough on 2 out of 3 sessions that more than 80% of volume flowed into advancing stocks. These kinds of thrusts have a positive and consistent record. Even more notably, there have been 33 of these sessions in 2020, close to a record year since 1962.

NOTE: We have amended this note at the end to include the fact that Up Volume once again surged above 80% after this was published.

The backbone of any positive bias since the spring has been the multitude of thrust and recovery signals. That turned a little iffy in July and August as oddities triggered, thanks to the overwhelming push by large tech stocks.

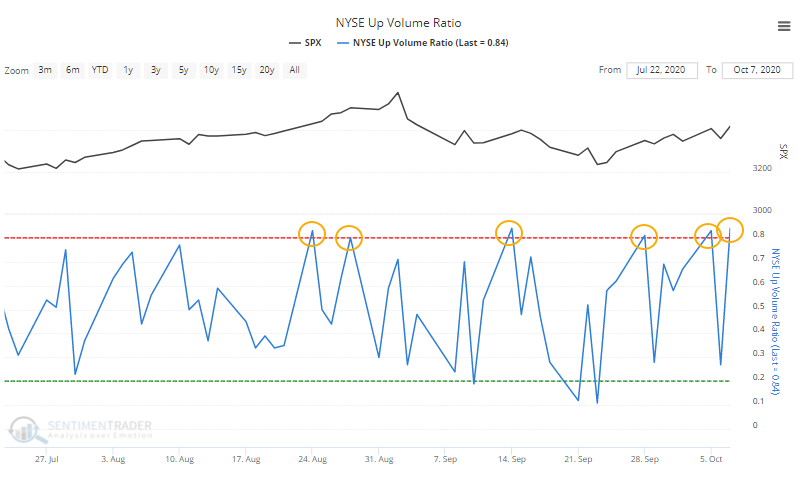
Lately, it has returned to a more normal market environment, and yet again on Wednesday, buyers were eager enough that more than 80% of volume on the NYSE exchange flowed into advancing securities.

That marked the 2nd day with more than 80% NYSE Up Volume in just the past 3 sessions.

It's not uncommon to see tight clusters of these days during big downtrends, as volatility is high. It's more unusual to see it when stocks are relatively close to their highs. When it has happened, it's been a good sign for forward returns.

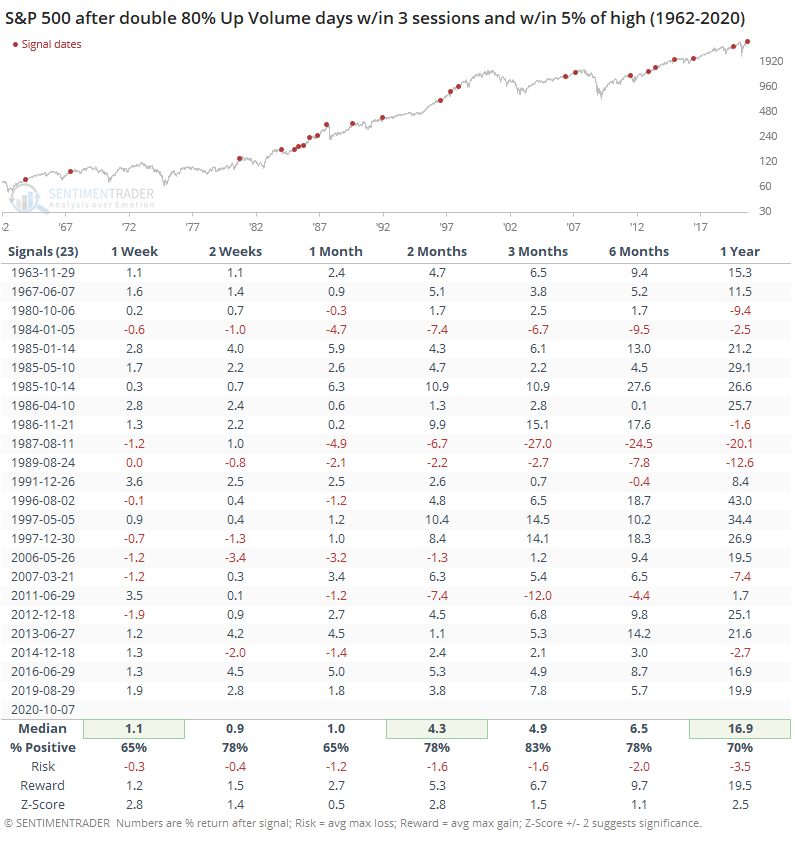
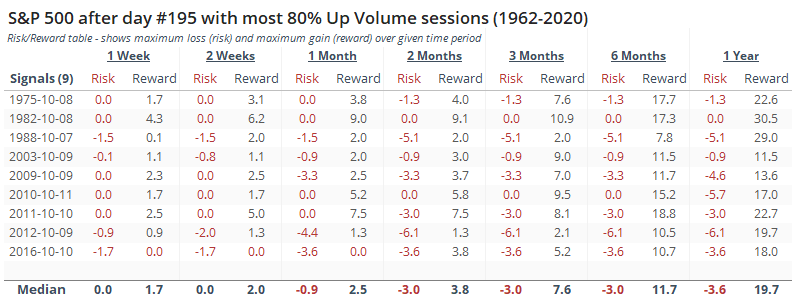
Over the next 3 months, there were 4 signals that saw a maximum loss of -5% or more at some point, compared to 16 signals that saw a maximum gain of +5% or more at some point. That helped skew the risk/reward ratio heavily to the positive side.

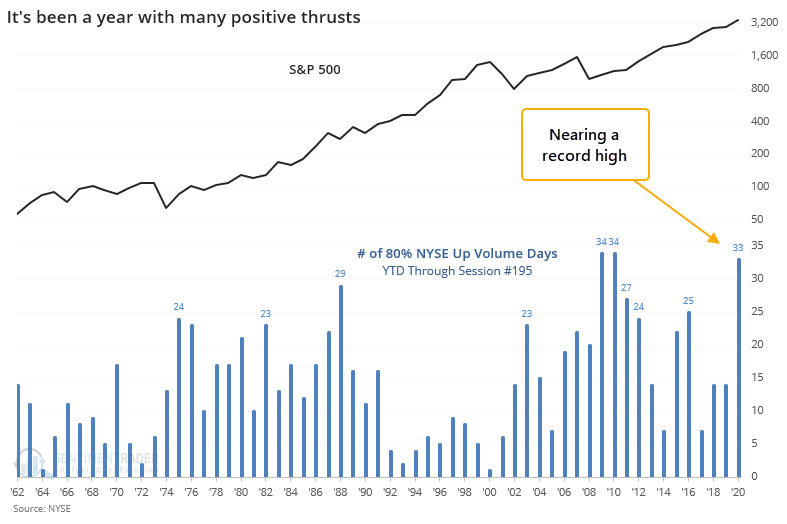
We can see from the chart above that the past few days have added to a multitude of 80% or greater Up Volume days since late August. Since the start of the year, there have been 33 of these days, nearing the all-time record dating back to 1962.

Years with a lot of these big up thrusts tended to be volatile, of course, but that didn't prevent extremely positive returns going forward.

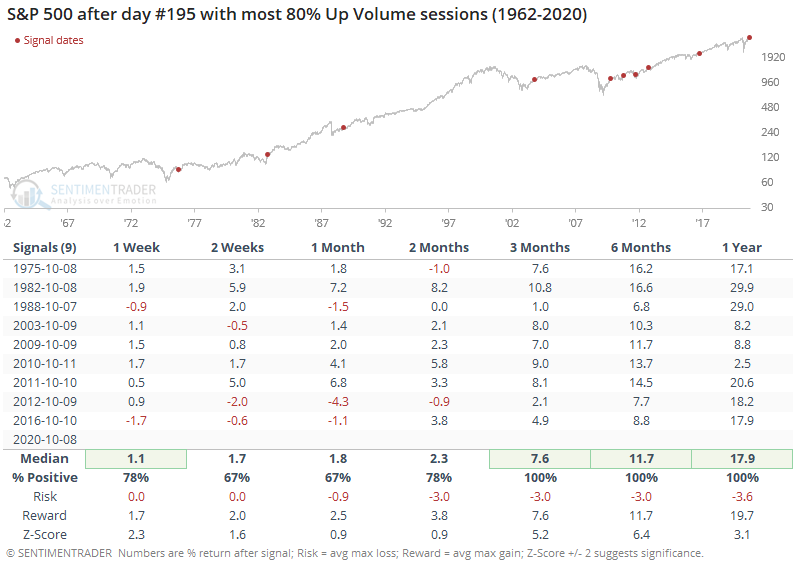
The risk/reward following these signals was almost ridiculously positive. During the next year, the most that any signal lost at any point was -6.1%. That compares to a maximum gain that was +11.5% or more after every one of them.

EDIT: The day this was published, Up Volume once again closed above 80%. This marks the 3rd day in the past 4 that saw a ratio above 80%. Below, we can see that tight clusters of such heavy buying pressure have preceded consistently positive returns.

When sentiment is positive enough that buyers are willing to plow into almost any stock that's up on the day, it says a lot about the attitude out there. Clusters of these days, like we saw several times during the spring, have an essentially unblemished record of pointing to higher stocks over the medium- to long-term. While there are troubling issues like the continued speculation of options traders, as long as we keep seeing breadth thrusts like this, it's hard to get too negative over a longer-term time frame.

Sorry, you don't have access to this report

Upgrade your subscription plan to get access
Go to Dasboard
DATA &
TECHnologies
IndicatorEdge
‍
BackTestEdge
‍
Other Tools
‍
DataEdge API
RESEARCH
reports
Research Solution
‍
Reports Library
‍
actionable
Strategies
Trading Strategies
‍
Smart Stock Scanner
‍
FREE
RESOUrCES
Simple Backtest
Calculator
Simple Seasonality
Calculator
The Kelly Criterion
Calculator
Sentiment Geo Map
‍
Public Research Reports
‍
Free Webinar
COMPANY
‍
About
‍
Meet our Team
‍
In the News
‍
Testimonials
‍
Client Success Stories
Pricing
Bundle pricing
‍
Announcements
‍
FAQ
© 2024 Sundial Capital Research Inc. All rights reserved.
Setsail Marketing
TermsPrivacyAffiliate Program
Risk Disclosure: Futures and forex trading contains substantial risk and is not for every investor. An investor could potentially lose all or more than the initial investment. Risk capital is money that can be lost without jeopardizing ones’ financial security or life style. Only risk capital should be used for trading and only those with sufficient risk capital should consider trading. Past performance is not necessarily indicative of future results.

Hypothetical Performance Disclosure: Hypothetical performance results have many inherent limitations, some of which are described below. No representation is being made that any account will or is likely to achieve profits or losses similar to those shown; in fact, there are frequently sharp differences between hypothetical performance results and the actual results subsequently achieved by any particular trading program. One of the limitations of hypothetical performance results is that they are generally prepared with the benefit of hindsight. In addition, hypothetical trading does not involve financial risk, and no hypothetical trading record can completely account for the impact of financial risk of actual trading. for example, the ability to withstand losses or to adhere to a particular trading program in spite of trading losses are material points which can also adversely affect actual trading results. There are numerous other factors related to the markets in general or to the implementation of any specific trading program which cannot be fully accounted for in the preparation of hypothetical performance results and all which can adversely affect trading results.

Testimonial Disclosure: Testimonials appearing on this website may not be representative of other clients or customers and is not a guarantee of future performance or success.