Products
SentimenTrader Trading Tools
‍
Backtest Engine
My Trading Toolkit
Correlation Analysis
Seasonality
Indicators & Data API
‍
Proprietary Indicators & Charts
Market Data API
Strategies & Scanner
‍
50+ Trading Strategies
Smart Stock Scanner
Research Reports
‍
Research Solutions
Reports Library
Free Resources
Simple Backtest Calculator
Simple Seasonality Calculator
The Kelly Criterion Calculator
Sentiment Geo Map
Public Research Reports
Pricing
Company
About
In the News
Testimonials
Client Success Stories
Contact
Log inLoginSign up
< BACK TO ALL REPORTS

Buy-losers-and-sell-winners hits historic proportions

Jason Goepfert
2020-11-10
Monday's lurch from large to small stocks, and from growth to value, was among the most extreme in 75 years. That builds on months of wide swings between them. There have been 2 other periods in history when this happened, both leading to massive shifts to small and value stocks.

Monday's session was one for the record books for multiple reasons. We went over some of them yesterday, with the overall tone being positive due to the types of stocks that were seeing the most buying interest.

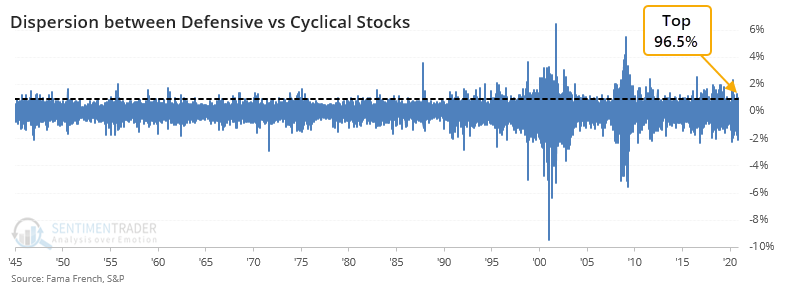
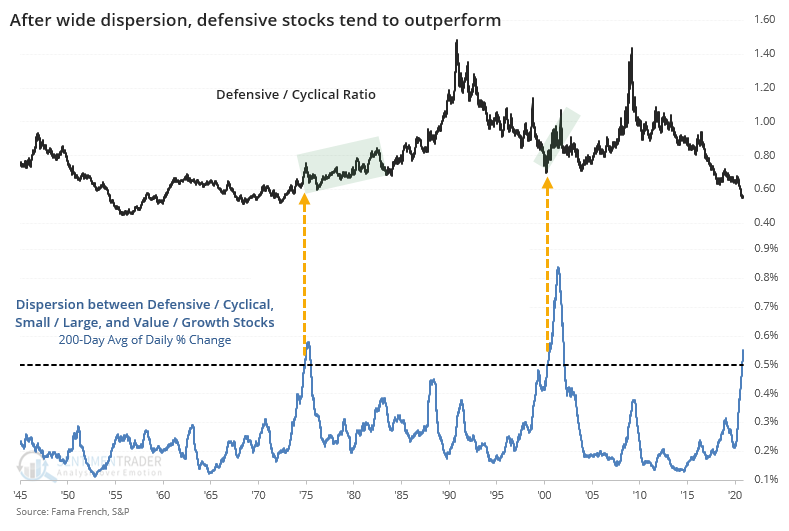
There was a clear shift from former winners to former losers. The spread in daily returns between defensive and cyclical stocks on Monday ranked in the top 96.5% of all readings since 1945.

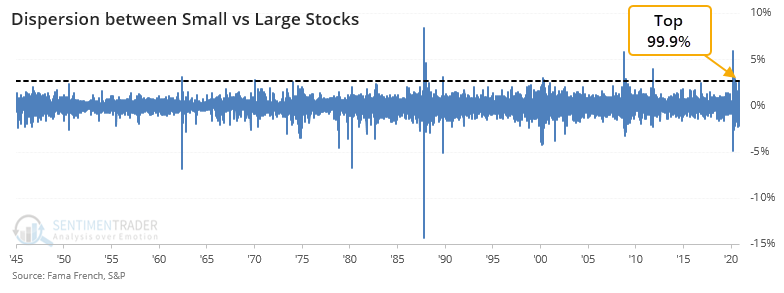
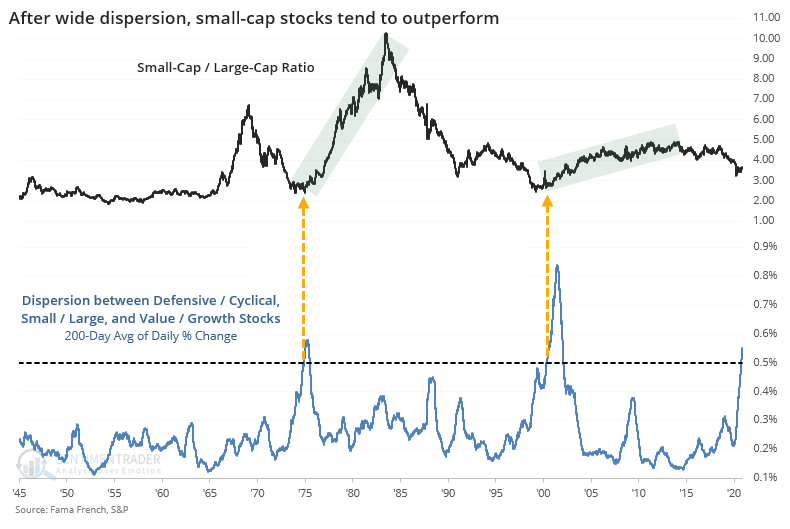
It was even starker between small- and large-cap stocks, with Monday's difference ranking in the top 99.9% of all readings.

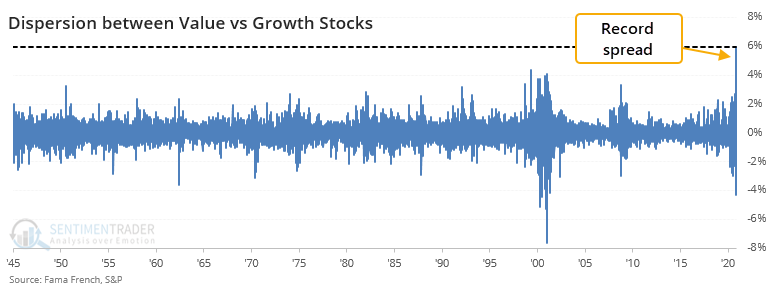
And greater still between value and growth stocks. The shift from growth to value on Monday had never been more extreme in the past 75 years.

If we look at those charts, then it's not just Monday's activity that stands out, but the wild differences in returns that have been evident for months. When we look at the absolute difference in price changes between all 6 factors over the past 200 days, then we've seen one of the truly extreme risk-on vs risk-off environments ever.

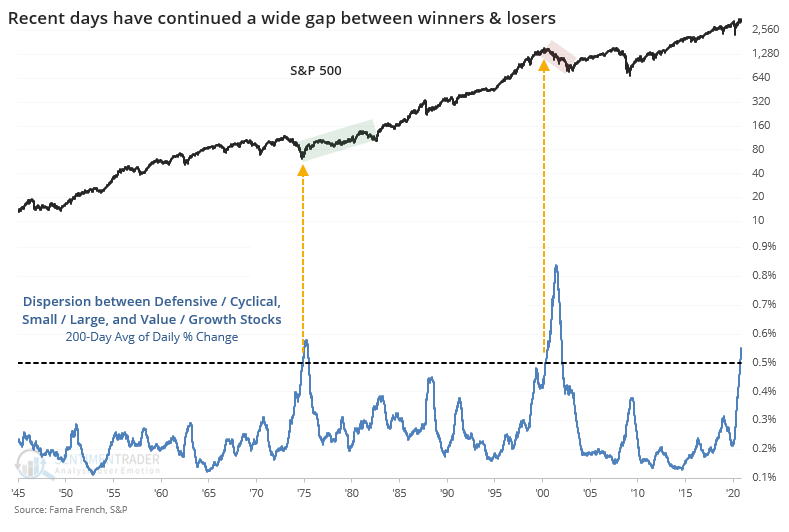
The only two time periods which exceeded the current one were in late 1975 and late 2000. Both coincided with important turning points in the broader market, one a trough and one a peak. There were 4 lesser extremes in 1983, 1988, 1991, and 2009, all following big dislocations in stocks, and all leading to higher prices for the S&P 500 going forward.

Let's look at these periods of wide dispersions versus the various factors. When we do that, we can see that defensive stocks typically did better than cyclical ones but it was not very consistent.

It was much more consistent to see small-cap stocks outperform large-cap ones. The two periods with dispersions as great as they are now both led to extended periods of smaller stocks doing better than larger ones.

The same pattern holds true for value versus growth stocks. By the time dispersion among the factors reached the current level, value stocks were about to embark on multiple years with massive outperformance relative to growth.

Investors have been looking for a turn in these relationships for years, and yet in most respects, they just keep getting more extreme. It seems like Monday's shock, building on the massive differences in positioning for most of this year, is enough to equate to some of the most notable changes in 75 years, and that has been a very good relative sign for small and value stocks.

Sorry, you don't have access to this report

Upgrade your subscription plan to get access
Go to Dasboard
PRODUCTS
SentimenTrader
Trading Tools
Indicators & Data API
‍
Strategies & Scanner
‍
Research Reports
FREE
RESOUrCES
Simple Backtest
Calculator
Simple Seasonality
Calculator
The Kelly Criterion
Calculator
Sentiment Geo Map
‍
Public Research Reports
‍
Pricing
Bundle pricing
‍
Announcements
‍
FAQ
COMPANY
‍
About
‍
In the News
‍
Testimonials
‍
Client Success Stories
CONTACT
‍
General Inquiries
‍
Media Inquiries
‍
Financial Professionals Inquiries
‍
© 2025 Sundial Capital Research Inc. All rights reserved.
Setsail Marketing
TermsPrivacyAffiliate Program
Risk Disclosure: Futures and forex trading contains substantial risk and is not for every investor. An investor could potentially lose all or more than the initial investment. Risk capital is money that can be lost without jeopardizing ones’ financial security or life style. Only risk capital should be used for trading and only those with sufficient risk capital should consider trading. Past performance is not necessarily indicative of future results.

Hypothetical Performance Disclosure: Hypothetical performance results have many inherent limitations, some of which are described below. No representation is being made that any account will or is likely to achieve profits or losses similar to those shown; in fact, there are frequently sharp differences between hypothetical performance results and the actual results subsequently achieved by any particular trading program. One of the limitations of hypothetical performance results is that they are generally prepared with the benefit of hindsight. In addition, hypothetical trading does not involve financial risk, and no hypothetical trading record can completely account for the impact of financial risk of actual trading. for example, the ability to withstand losses or to adhere to a particular trading program in spite of trading losses are material points which can also adversely affect actual trading results. There are numerous other factors related to the markets in general or to the implementation of any specific trading program which cannot be fully accounted for in the preparation of hypothetical performance results and all which can adversely affect trading results.

Testimonial Disclosure: Testimonials appearing on this website may not be representative of other clients or customers and is not a guarantee of future performance or success.