Products
SentimenTrader Trading Tools
‍
Backtest Engine
My Trading Toolkit
Correlation Analysis
Seasonality
Market Prediction
Indicators & Data API
‍
Proprietary Indicators & Charts
Market Data API
Strategies & Scanner
‍
50+ Trading Strategies
Smart Stock Scanner
Smart Option Scanner
Research Reports
‍
Research Solutions
Reports Library
Free Resources
Simple Backtest Calculator
Simple Seasonality Calculator
The Kelly Criterion Calculator
Sentiment Geo Map
Public Research Reports
Education
Sentiment Indicators
Technical Indicators
Pricing
Company
About
In the News
Testimonials
Client Success Stories
Contact
Log inLoginSign up
< BACK TO ALL REPORTS

BTFD is back and better than ever

Jason Goepfert
2024-10-21
The S&P 500 has enjoyed 30 sessions without suffering back-to-back losses, one of the longest streaks in its history. The Nasdaq Composite has gone even longer without consecutive losses. This BTFD mentality has led to mixed short-term returns but impressive gains over the next 6-12 months.

Key points:

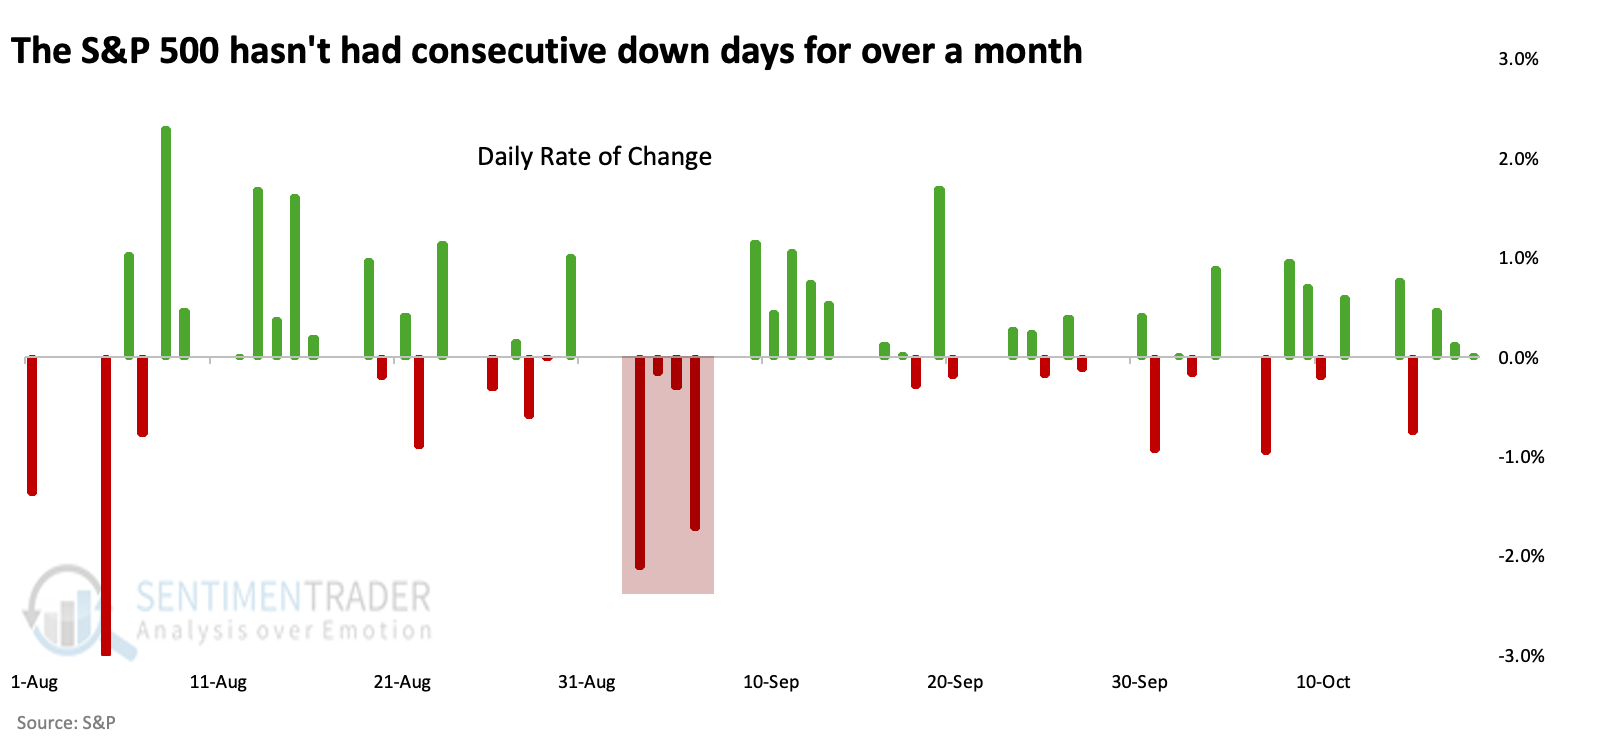
  • The S&P 500 has gone 30 sessions without suffering back-to-back losses
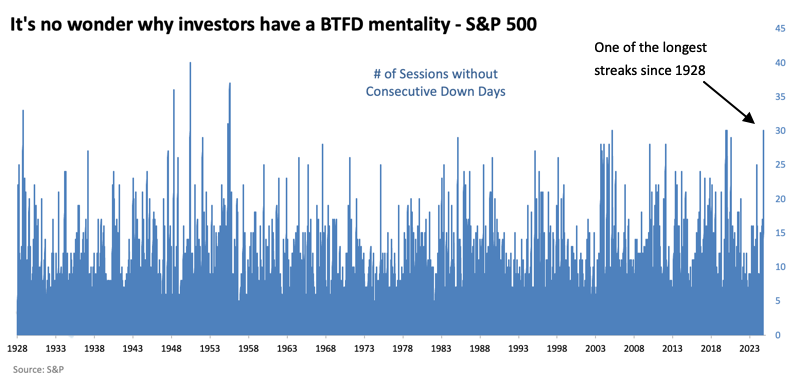
  • This is one of the longest streaks in its history, with the Nasdaq not far behind
  • Similar streaks of BTFD activity preceded gains over the next 6-12 months almost without fail

It's been a long time since back-to-back losses

The world's most venerable stock market average has had a multi-timeframe run unlike any other in its long history.

It's not alone.

The index serving as the most widely-used benchmark in the world is having a historic run of its own. Over the past 30 sessions, the S&P 500 has not suffered the ignominy of back-to-back down days.

A month without consecutive down days may not sound like much, but it is. In the index's history, it has rarely gone this long without at least small sessions of back-to-back losses. The current streak ranks among the very best since 1928.

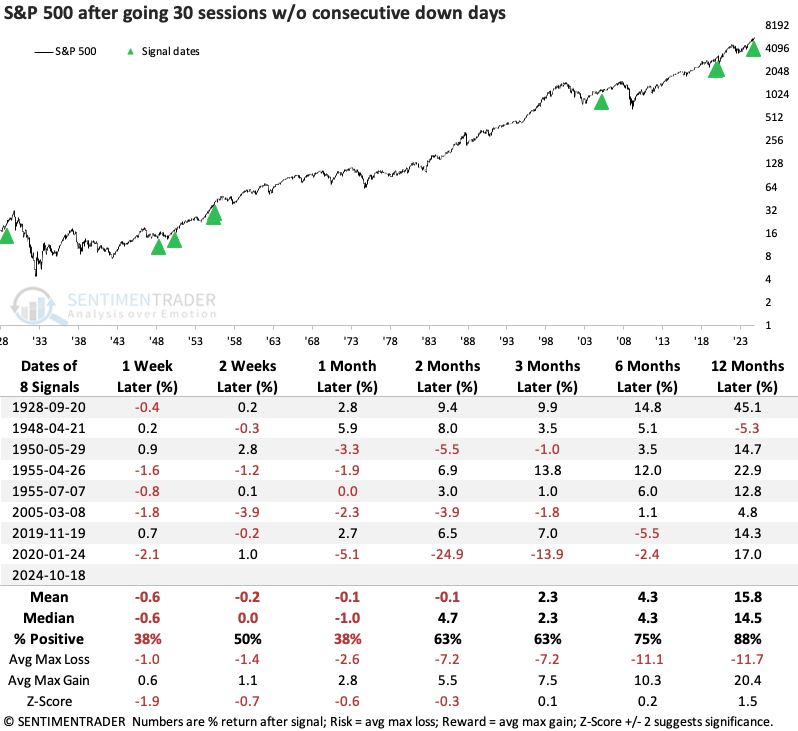
We're more concerned with potential implications than the sheer trivia of it. So, the table below shows the S&P's forward returns after the other times investors showed such a willingness to "Buy The F***ing Dip."

It wasn't much to write home about in the short term, as even the BTFD crowd can get nervous. Over the next month, only one signal, way back in 1928, showed a gain both two and four weeks later. However, other than the pandemic-interrupted signal in 2020, any selling was minor and temporary. Over the next year, only one precedent was a loser, and that was the only signal that did not trigger when the S&P was trading near a multi-year high.

Nasdaq version

On the more tech-heavy side of the ledger, the Nasdaq Composite has had its own impressive brush with BTFD. That index has many more constituent stocks with a lot less quality, but even that hasn't prevented it from going on some long streaks without back-to-back losses.

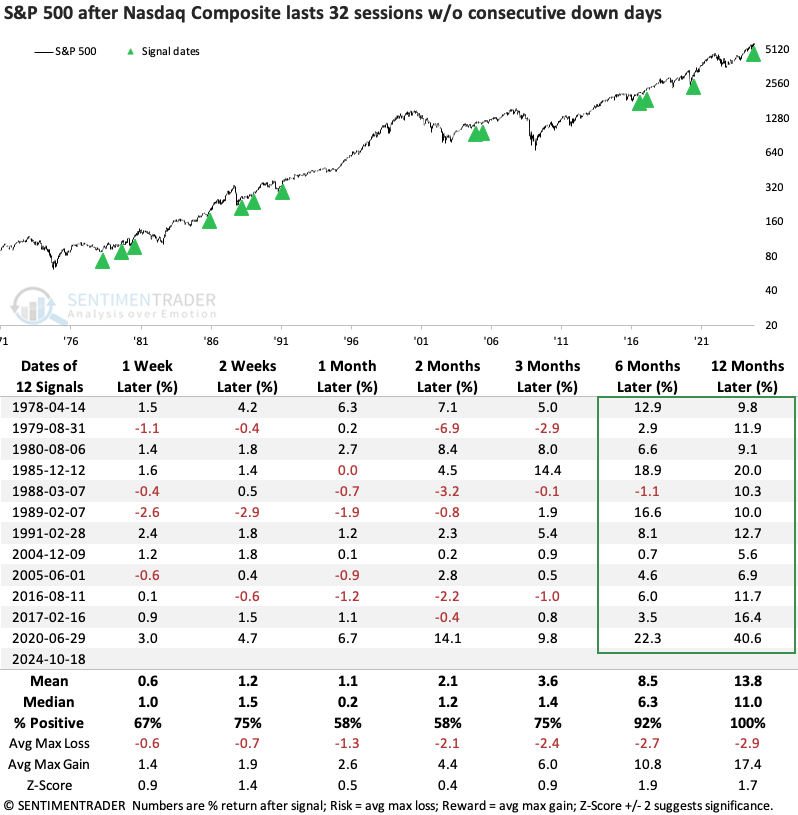
The current streak of 32 sessions still ranks among the best since the index's inception 53 years ago. Going 32 days without consecutive losses has been a compelling sign of persistent positive sentiment. It suffered one tiny loss over the next six months out of a dozen tries and was never in negative territory over the following year. The risk/reward ratio was tilted heavily in favor of reward.

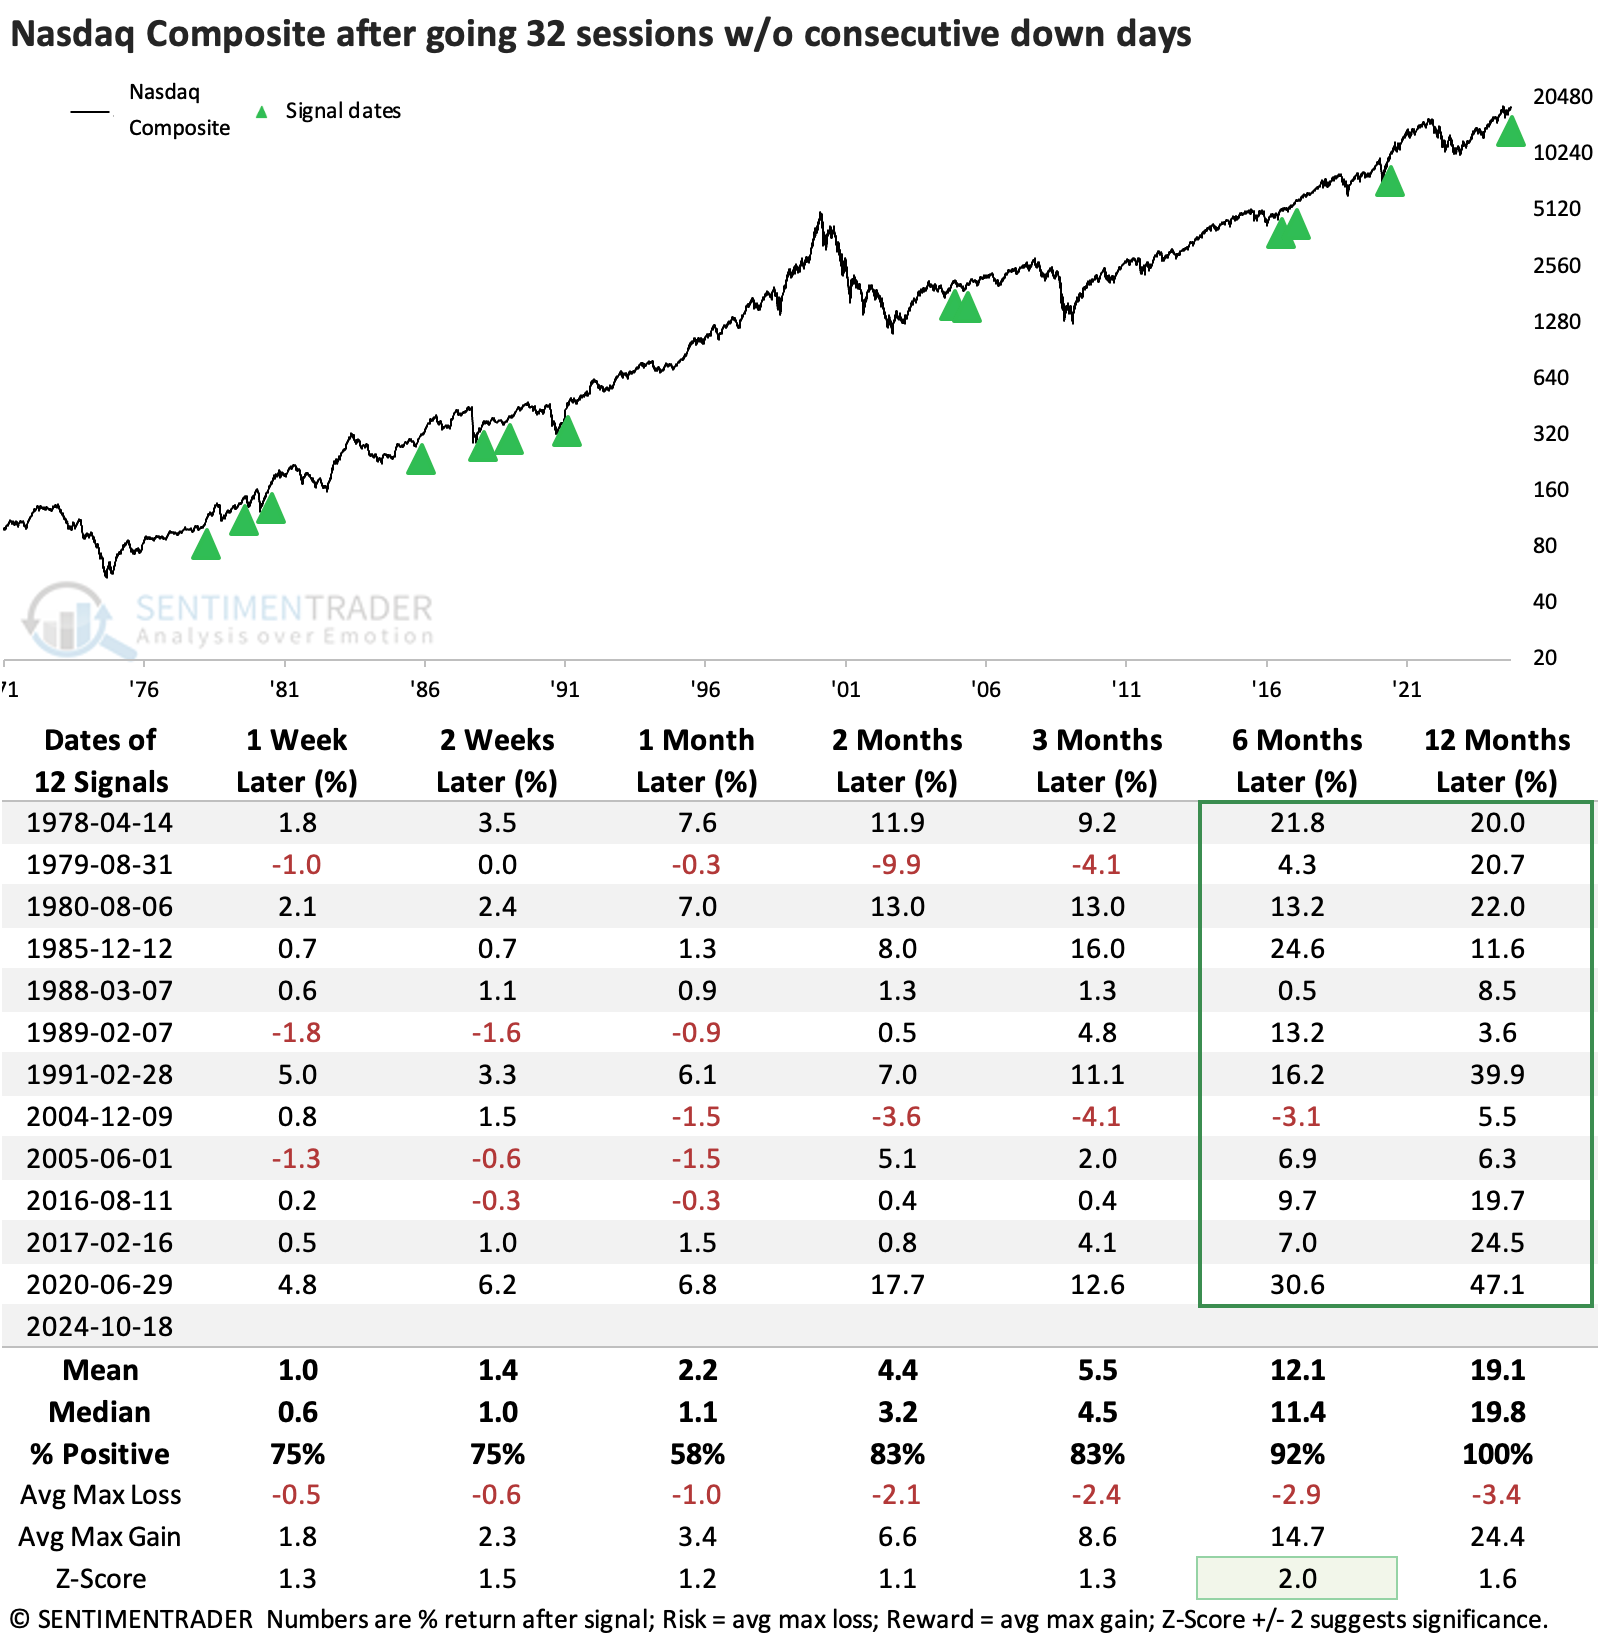
Good returns on the Nasdaq were good for other stocks, too. The S&P also witnessed only a slight loss over the next six months (a smaller one than the Nasdaq, even) and was also higher a year later every time.

What the research tells us...

Over the last couple of weeks, we've outlined the impressive momentum underlying major indices and their component stocks and sectors multiple times. This type of force is rarely seen and rarely occurs near significant and protracted declines.

The biggest negative is that the momentum is getting recognized, and investors feel left out. That typically means they will bid up prices without regard to fundamentals, which sows the seeds of its own destruction. Sentiment is elevated, for sure, which is a modest concern. It's not at levels like we saw in 2021, and so far, there are few signs that internal momentum is waning. Until we see more evidence of that, the BFTD crowd looks to have the edge, especially over longer time horizons.

PRODUCTS
SentimenTrader
Trading Tools
Indicators & Data API
‍
Strategies & Scanner
‍
Research Reports
FREE
RESOUrCES
Simple Backtest
Calculator
Simple Seasonality
Calculator
The Kelly Criterion
Calculator
Sentiment Geo Map
‍
Public Research Reports
‍
Education
Sentiment Indicators
‍
Technical Indicators
‍
Pricing
Bundle pricing
‍
FAQ
‍
Announcements
‍
COMPANY
‍
About
‍
In the News
‍
Testimonials
‍
Client Success Stories
CONTACT
‍
General Inquiries
‍
Media Inquiries
‍
Financial Professionals Inquiries
‍
© 2026 Sundial Capital Research Inc. All rights reserved.
Setsail Marketing
TermsPrivacyAffiliate Program
Risk Disclosure: The information and tools provided are for research and analytical purposes only and are not intended as investment advice. Market analysis involves uncertainty, and outcomes may differ from expectations. Users should conduct their own due diligence and consider their individual circumstances before making any financial decisions. Past performance is not necessarily indicative of future results.

Hypothetical Performance Disclosure: Hypothetical performance results have many inherent limitations, some of which are described below. No representation is being made that any account will or is likely to achieve profits or losses similar to those shown; in fact, there are frequently sharp differences between hypothetical performance results and the actual results subsequently achieved by any particular trading program. One of the limitations of hypothetical performance results is that they are generally prepared with the benefit of hindsight. In addition, hypothetical trading does not involve financial risk, and no hypothetical trading record can completely account for the impact of financial risk of actual trading. for example, the ability to withstand losses or to adhere to a particular trading program in spite of trading losses are material points which can also adversely affect actual trading results. There are numerous other factors related to the markets in general or to the implementation of any specific trading program which cannot be fully accounted for in the preparation of hypothetical performance results and all which can adversely affect trading results.

Testimonial Disclosure: Testimonials appearing on this website may not be representative of other clients or customers and is not a guarantee of future performance or success.