Data &
Technology
Research
Reports
Report Solutions
Reports Library
Actionable
Strategies
Free
Resources
Simple Backtest Calculator
Simple Seasonality Calculator
The Kelly Criterion Calculator
Sentiment Geo Map
Public Research Reports
Free Webinar
Pricing
Company
About
Meet Our Team
In the News
Testimonials
Client Success Stories
Contact
Log inLoginSign up
< BACK TO ALL REPORTS

Broad display of medium-term uptrends during long-term downtrends

Jason Goepfert
2020-06-19
All (or almost all) industries, sectors, and worldwide equity indexes are trading above their 50-day moving averages. But as we saw on Thursday, few have yet managed to hold above their 200-day averages. This happens during the initial kick-off stage of long-term recoveries. In the past, this raised investors' risks short-term but led to long-term positive returns.

As we monitor the rally for health and watch how many stocks, industries, sectors, and countries are able to hold their trends, we're seeing an unusual battle between time frames.

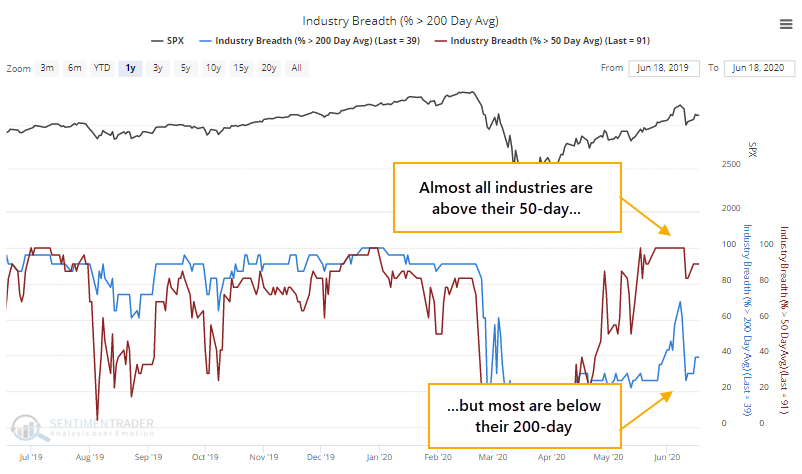
For about half of the trading days over the past month, almost all industry indexes have managed to hold above their 50-day moving averages, but not even half of them have held above their 200-day averages.

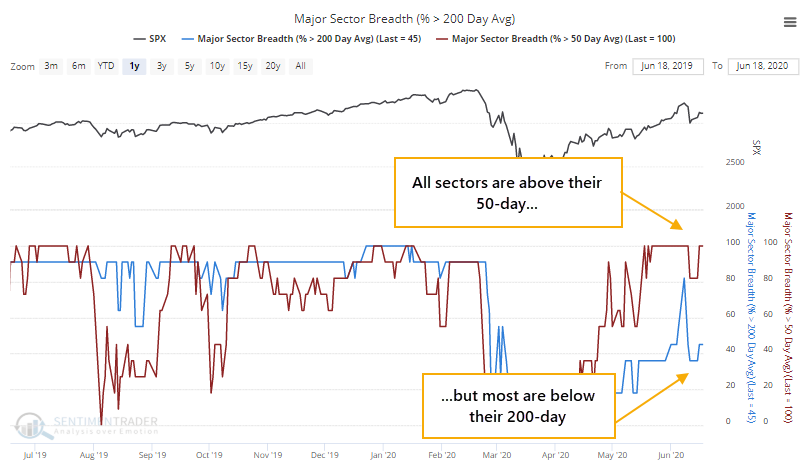
Same goes for the major sectors. Because there are fewer of them, it's even more extreme. All sectors have consistently held above their 50-day, while less than half of them have managed to hold their 200-day.

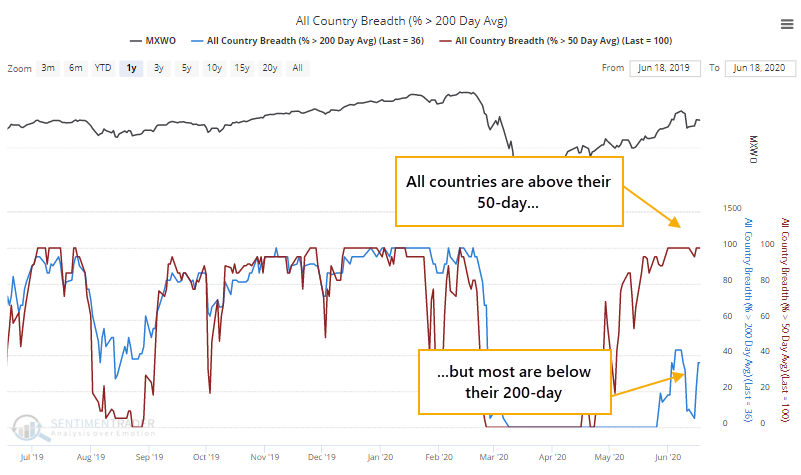
We're seeing almost the exact same thing among major world equity indexes, with all of them above their 50-day but few above their 200-day.

When we see breadth thrusts, like an overwhelming majority of stocks and indexes trading above their 50-day averages, it has consistently signaled intense buying interest that tends to continue. But when we see fewer than 60% of stocks and indexes holding above their 200-day averages, that has tended to occur during unhealthy markets, like we saw on Thursday.

Going back as far as we can, the table below shows other times when there was this kind of protracted battle between all (or almost all) industries, sectors, or countries trading above their 50-day moving averages while less half of them managed to hold above their 200-day averages. The signals only include dates when this tension triggered for at least 10 out of 20 sessions.

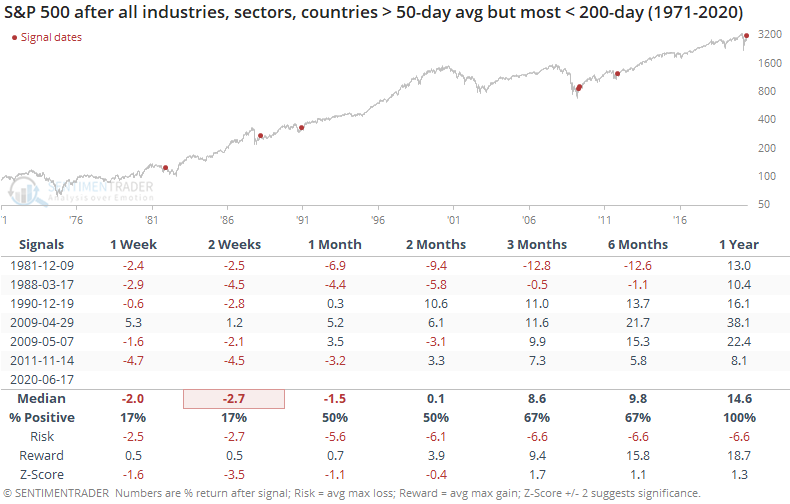
It's no surprise that every one of them triggered during the initial kick-off from deeply oversold conditions. These are times when a market decline was protracted and deep enough to push almost all equities into downtrends, then there was a medium-term burst of optimism and buying pressure.

By the time it reached this level, stocks were tired. The S&P managed to add to its gains only once over the next couple of weeks. The decline persisted in 1981, but that was really the only false signal. The rest were good indications that the bulk of the decline was over, and markets were on the path to recovery.

Like most of the other developments we've seen in recent weeks, this suggests shorter-term risk, but longer-term reward.

DATA &
TECHnologies
IndicatorEdge
‍
BackTestEdge
‍
Other Tools
‍
DataEdge API
RESEARCH
reports
Research Solution
‍
Reports Library
‍
actionable
Strategies
Trading Strategies
‍
Smart Stock Scanner
‍
FREE
RESOUrCES
Simple Backtest
Calculator
Simple Seasonality
Calculator
The Kelly Criterion
Calculator
Sentiment Geo Map
‍
Public Research Reports
‍
Free Webinar
COMPANY
‍
About
‍
Meet our Team
‍
In the News
‍
Testimonials
‍
Client Success Stories
Pricing
Bundle pricing
‍
Announcements
‍
FAQ
© 2024 Sundial Capital Research Inc. All rights reserved.
Setsail Marketing
TermsPrivacyAffiliate Program
Risk Disclosure: Futures and forex trading contains substantial risk and is not for every investor. An investor could potentially lose all or more than the initial investment. Risk capital is money that can be lost without jeopardizing ones’ financial security or life style. Only risk capital should be used for trading and only those with sufficient risk capital should consider trading. Past performance is not necessarily indicative of future results.

Hypothetical Performance Disclosure: Hypothetical performance results have many inherent limitations, some of which are described below. No representation is being made that any account will or is likely to achieve profits or losses similar to those shown; in fact, there are frequently sharp differences between hypothetical performance results and the actual results subsequently achieved by any particular trading program. One of the limitations of hypothetical performance results is that they are generally prepared with the benefit of hindsight. In addition, hypothetical trading does not involve financial risk, and no hypothetical trading record can completely account for the impact of financial risk of actual trading. for example, the ability to withstand losses or to adhere to a particular trading program in spite of trading losses are material points which can also adversely affect actual trading results. There are numerous other factors related to the markets in general or to the implementation of any specific trading program which cannot be fully accounted for in the preparation of hypothetical performance results and all which can adversely affect trading results.

Testimonial Disclosure: Testimonials appearing on this website may not be representative of other clients or customers and is not a guarantee of future performance or success.