Data &
Technology
Research
Reports
Report Solutions
Reports Library
Actionable
Strategies
Free
Resources
Simple Backtest Calculator
Simple Seasonality Calculator
The Kelly Criterion Calculator
Sentiment Geo Map
Public Research Reports
Free Webinar
Pricing
Company
About
Meet Our Team
In the News
Testimonials
Client Success Stories
Contact
Log inLoginSign up
< BACK TO ALL REPORTS

Breakouts & sector rotation

Troy Bombardia
2020-11-10
Tech stocks had been outperforming for months before yesterday's vaccine news. But on the vaccine news, tech stocks significantly underperformed non-tech stocks and the Dow Jones Industrial Average made a new intraday all-time high.

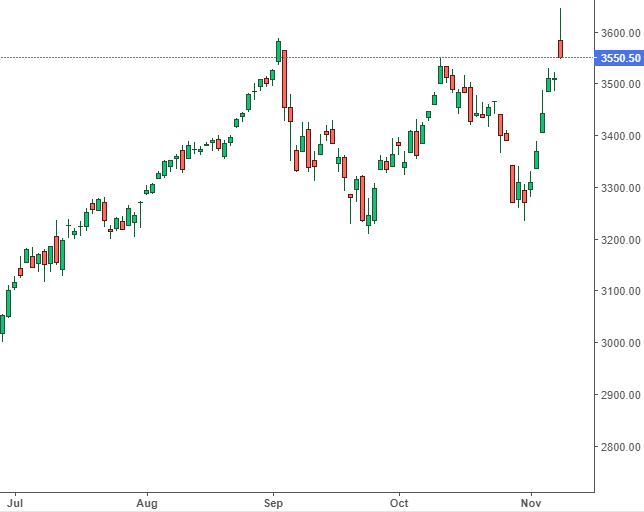
Yesterday's price action was interesting, to say the least. Tech stocks had been outperforming for months before yesterday's vaccine news. But on the vaccine news, tech stocks significantly underperformed non-tech stocks and the Dow Jones Industrial Average made a new intraday all-time high. But as the day drew to a close, stocks slipped, resulting in what some technical analysts may consider to be an ugly candlestick bar:

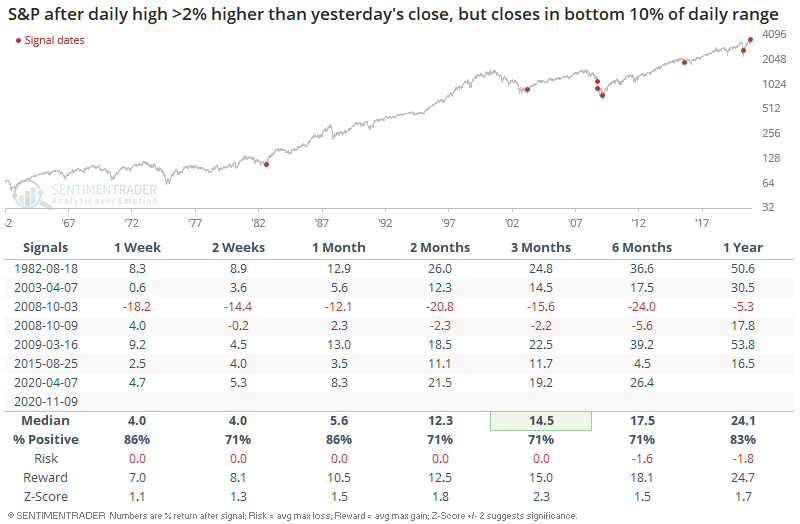
But that's the problem with most candlestick patterns: they aren't much better than a 50/50 coin toss. When the S&P gapped up and then closed near the intraday low, you would assume that it's a bearish sign for stocks. Historically, that was not the case:

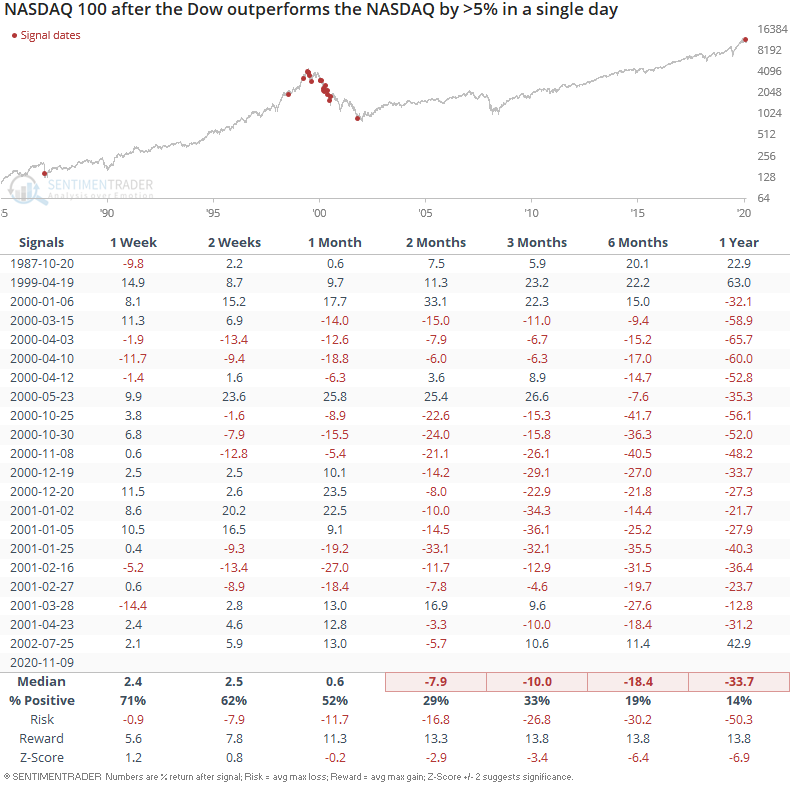
More importantly, the massive sector rotation from stocks that were aided by the pandemic (e.g. tech) vs. stocks that were hurt by the pandemic (e.g. airlines, banks, travel & tourism) saw the Dow Jones Industrial Average outperform the NASDAQ 100 by more than 5%. 

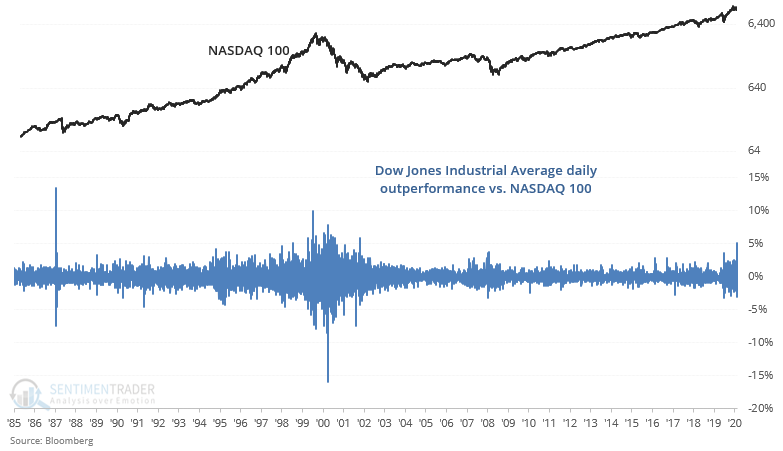
Outside from 1987 (which occurred after a market crash), this only occurred in 1999-2002. The 2000 cases are particularly interesting because we can draw some parallels to today. Tech surged in 1999 while "old economy" Dow stocks lagged. Subsequently Dow stocks outperformed in 2000-2001 as tech stocks cratered. This could be seen through the returns of legendary investors such as Warren Buffett, who lagged from 1998-1999 and outperformed from 2000-2002.

The last 7 months saw tech stocks surge while many other stocks languished. Could this be the start of a great sector rotation out of tech?

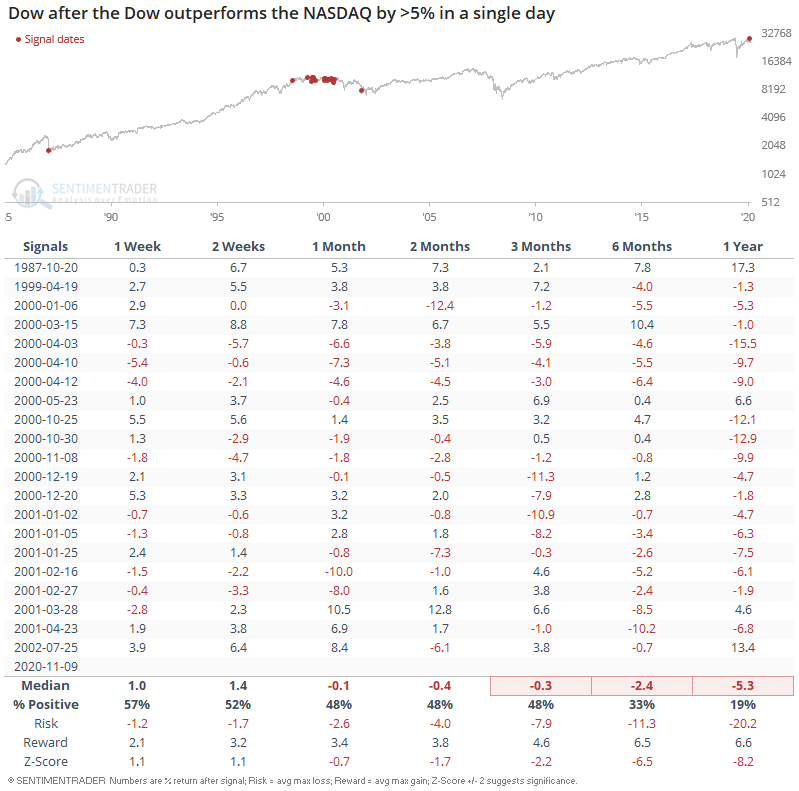
The following illustrates what happened next to the Dow:

*clearly not as bad as what happened next to the NASDAQ

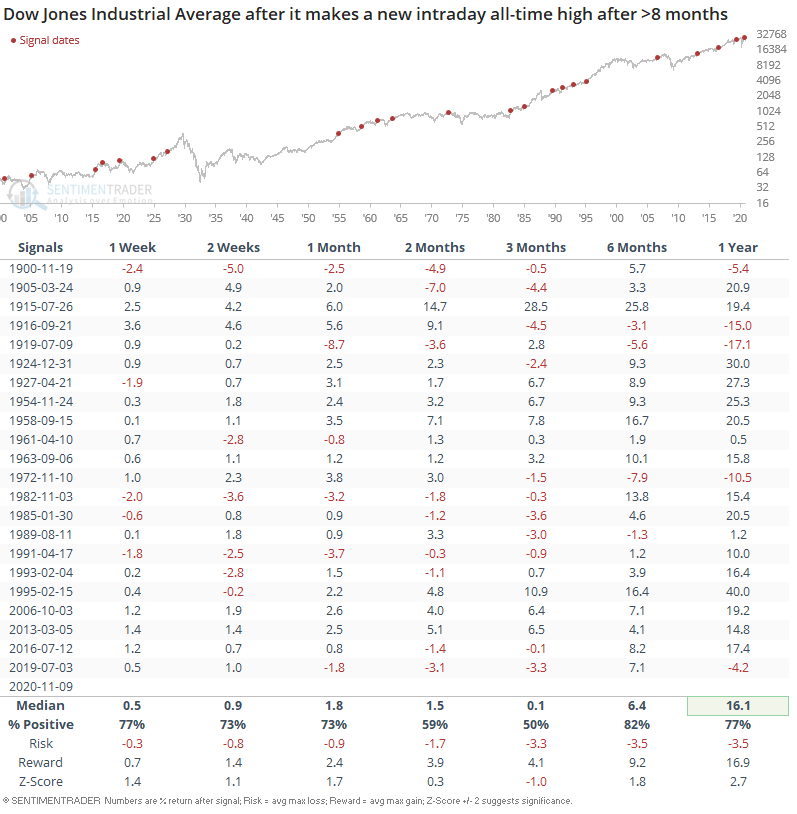
And finally, the Dow Jones Industrial Average broke out to a new intraday all-time high:

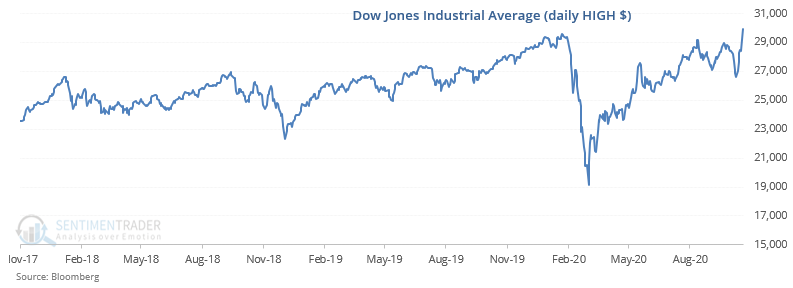
Such breakouts have historically been bullish for stocks over the next year. The main bearish breakouts occurred in the early-1900s, and that's primarily because dividend yields pre-1958 were much higher than dividend yields post-1958. So while it looks like stocks went nowhere in the first quarter of the 20th century, total return analysis states otherwise.

Sorry, you don't have access to this report

Upgrade your subscription plan to get access
Go to Dasboard
DATA &
TECHnologies
IndicatorEdge
‍
BackTestEdge
‍
Other Tools
‍
DataEdge API
RESEARCH
reports
Research Solution
‍
Reports Library
‍
actionable
Strategies
Trading Strategies
‍
Smart Stock Scanner
‍
FREE
RESOUrCES
Simple Backtest
Calculator
Simple Seasonality
Calculator
The Kelly Criterion
Calculator
Sentiment Geo Map
‍
Public Research Reports
‍
Free Webinar
COMPANY
‍
About
‍
Meet our Team
‍
In the News
‍
Testimonials
‍
Client Success Stories
Pricing
Bundle pricing
‍
Announcements
‍
FAQ
© 2024 Sundial Capital Research Inc. All rights reserved.
Setsail Marketing
TermsPrivacyAffiliate Program
Risk Disclosure: Futures and forex trading contains substantial risk and is not for every investor. An investor could potentially lose all or more than the initial investment. Risk capital is money that can be lost without jeopardizing ones’ financial security or life style. Only risk capital should be used for trading and only those with sufficient risk capital should consider trading. Past performance is not necessarily indicative of future results.

Hypothetical Performance Disclosure: Hypothetical performance results have many inherent limitations, some of which are described below. No representation is being made that any account will or is likely to achieve profits or losses similar to those shown; in fact, there are frequently sharp differences between hypothetical performance results and the actual results subsequently achieved by any particular trading program. One of the limitations of hypothetical performance results is that they are generally prepared with the benefit of hindsight. In addition, hypothetical trading does not involve financial risk, and no hypothetical trading record can completely account for the impact of financial risk of actual trading. for example, the ability to withstand losses or to adhere to a particular trading program in spite of trading losses are material points which can also adversely affect actual trading results. There are numerous other factors related to the markets in general or to the implementation of any specific trading program which cannot be fully accounted for in the preparation of hypothetical performance results and all which can adversely affect trading results.

Testimonial Disclosure: Testimonials appearing on this website may not be representative of other clients or customers and is not a guarantee of future performance or success.