Data &
Technology
Research
Reports
Report Solutions
Reports Library
Actionable
Strategies
Free
Resources
Simple Backtest Calculator
Simple Seasonality Calculator
The Kelly Criterion Calculator
Sentiment Geo Map
Public Research Reports
Free Webinar
Pricing
Company
About
Meet Our Team
In the News
Testimonials
Client Success Stories
Contact
Log inLoginSign up
< BACK TO ALL REPORTS

Breadth Thrust In Euro Stocks

Jason Goepfert
2017-01-04
null

With the big rally in major stocks in the eurozone (at least in euro terms), the most impressive breadth readings in the world have now been recorded in those stocks.

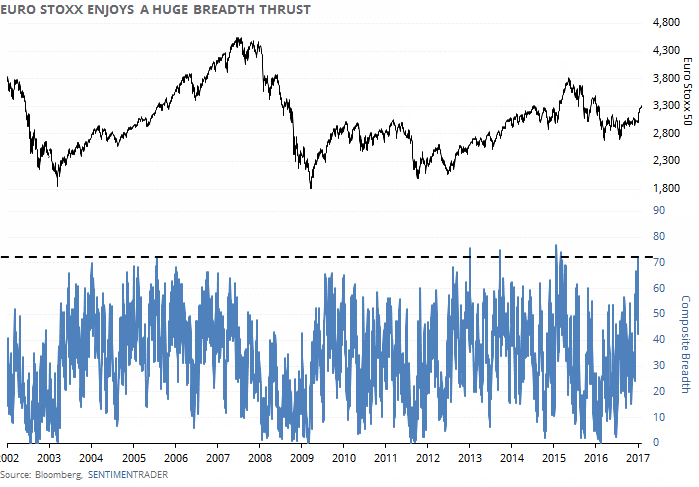
Looking at an array of indicators across time frames, we can see that there has been a huge block of buying interest in the stocks that make up the Euro Stoxx 50 index.

  • % of members > 10-day average: 86%
  • % of members > 50-day average: 96%
  • % of members > 200-day average: 82%
  • % of members at a 1-month high: 70%
  • % of members at a 3-month high: 58%
  • % of members at a 1-year high: 40%

All of those readings individually are among the highest in 15 years, so it's no surprise that if we take a simple average of them, the current reading of 72% is also among the best in that span.

20170103_eurobreadth_chart

It's hard to see from the chart what that led to, so the table below outlines the returns in the Euro Stoxx 50 index when this composite breadth reading exceeded 70%. These are in euro terms.

20170103_eurobreadth

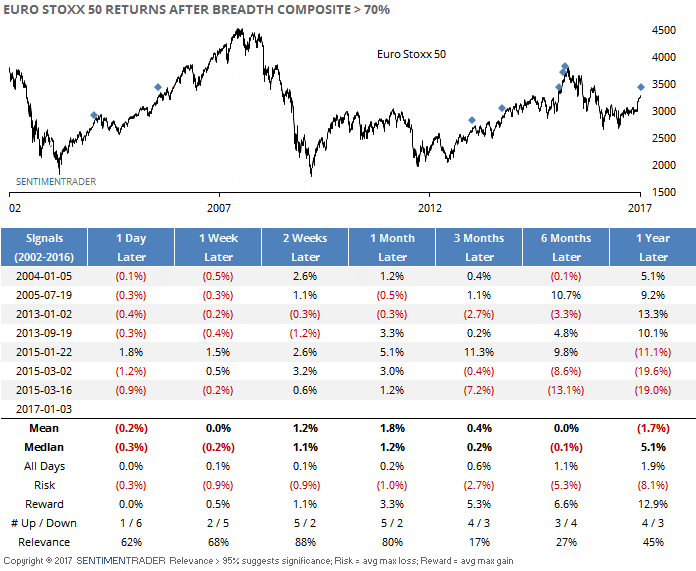
We can see that other than a short-term breather, the index tended to do well over the next several weeks. Its best performance was 2-4 weeks later when it was higher 5 out of 7 times, with an impressive average return and risk/reward ratio. After that, it was less consistent as some selling pressure came in.

Now let's look at it in U.S. dollar terms:

20170103_eurobreadth_dollars

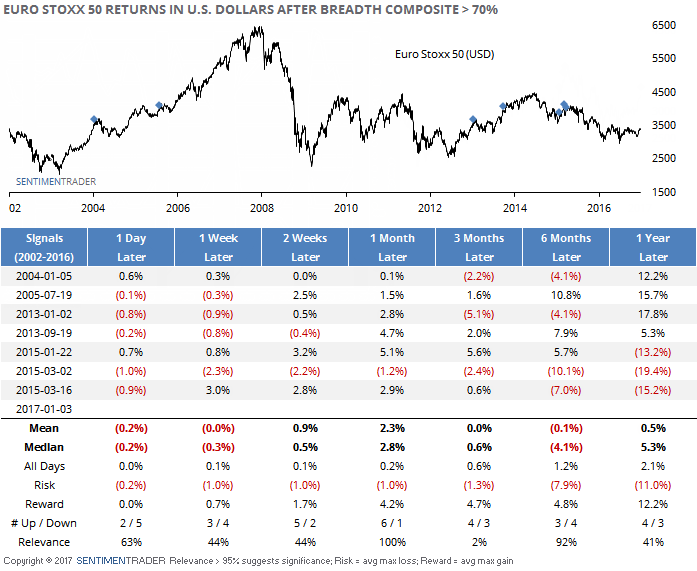
The same pattern holds, but it tended to do even better over the next month, and worse over the next six months as currency effects had more of an impact.

The thrust we've seen to start the year in these stocks should lead to something of a pullback in the short-term as buyers rest, but in the weeks ahead, it would be unusual if that was "it" for the momentum and we didn't see another run higher. In the U.S., the most popular ETF that mimics the index is FEZ.

Sorry, you don't have access to this report

Upgrade your subscription plan to get access
Go to Dasboard
DATA &
TECHnologies
IndicatorEdge
‍
BackTestEdge
‍
Other Tools
‍
DataEdge API
RESEARCH
reports
Research Solution
‍
Reports Library
‍
actionable
Strategies
Trading Strategies
‍
Smart Stock Scanner
‍
FREE
RESOUrCES
Simple Backtest
Calculator
Simple Seasonality
Calculator
The Kelly Criterion
Calculator
Sentiment Geo Map
‍
Public Research Reports
‍
Free Webinar
COMPANY
‍
About
‍
Meet our Team
‍
In the News
‍
Testimonials
‍
Client Success Stories
Pricing
Bundle pricing
‍
Announcements
‍
FAQ
© 2024 Sundial Capital Research Inc. All rights reserved.
Setsail Marketing
TermsPrivacyAffiliate Program
Risk Disclosure: Futures and forex trading contains substantial risk and is not for every investor. An investor could potentially lose all or more than the initial investment. Risk capital is money that can be lost without jeopardizing ones’ financial security or life style. Only risk capital should be used for trading and only those with sufficient risk capital should consider trading. Past performance is not necessarily indicative of future results.

Hypothetical Performance Disclosure: Hypothetical performance results have many inherent limitations, some of which are described below. No representation is being made that any account will or is likely to achieve profits or losses similar to those shown; in fact, there are frequently sharp differences between hypothetical performance results and the actual results subsequently achieved by any particular trading program. One of the limitations of hypothetical performance results is that they are generally prepared with the benefit of hindsight. In addition, hypothetical trading does not involve financial risk, and no hypothetical trading record can completely account for the impact of financial risk of actual trading. for example, the ability to withstand losses or to adhere to a particular trading program in spite of trading losses are material points which can also adversely affect actual trading results. There are numerous other factors related to the markets in general or to the implementation of any specific trading program which cannot be fully accounted for in the preparation of hypothetical performance results and all which can adversely affect trading results.

Testimonial Disclosure: Testimonials appearing on this website may not be representative of other clients or customers and is not a guarantee of future performance or success.