Data &
Technology
Research
Reports
Report Solutions
Reports Library
Actionable
Strategies
Free
Resources
Simple Backtest Calculator
Simple Seasonality Calculator
The Kelly Criterion Calculator
Sentiment Geo Map
Public Research Reports
Free Webinar
Pricing
Company
About
Meet Our Team
In the News
Testimonials
Client Success Stories
Contact
Log inLoginSign up
< BACK TO ALL REPORTS

Breadth is recovering, too

Jason Goepfert
2020-04-09
An increasing number of stocks are recovering after hitting a historic level of oversold in March. That is causing the McClellan Summation to curl up and new 52-week highs to outnumber 52-week lows. We also just saw a 2nd day with 90% Up Volume, a rare and powerful thrust signal.

Earlier, we looked at recoveries in sentiment from deep pessimism. Short-term returns were not encouraging, especially during unhealthy market environments. If stocks can continue to recover despite "not pessimism," it will go a long way toward the idea that we're still in the midst of a mostly positive long-term market trend.

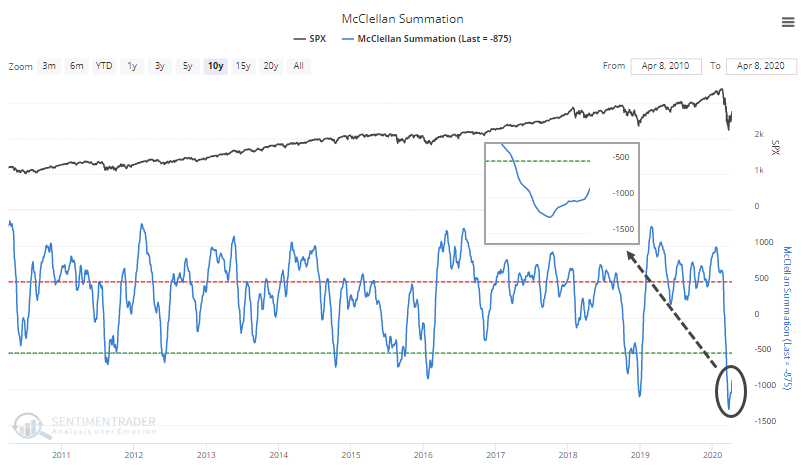
Optimism has been returning because more and more stocks have been coming along for the ride.

The long-term McClellan Summation Index is curling higher after the most oversold reading in a decade. It has climbed above -1000 after several weeks below.

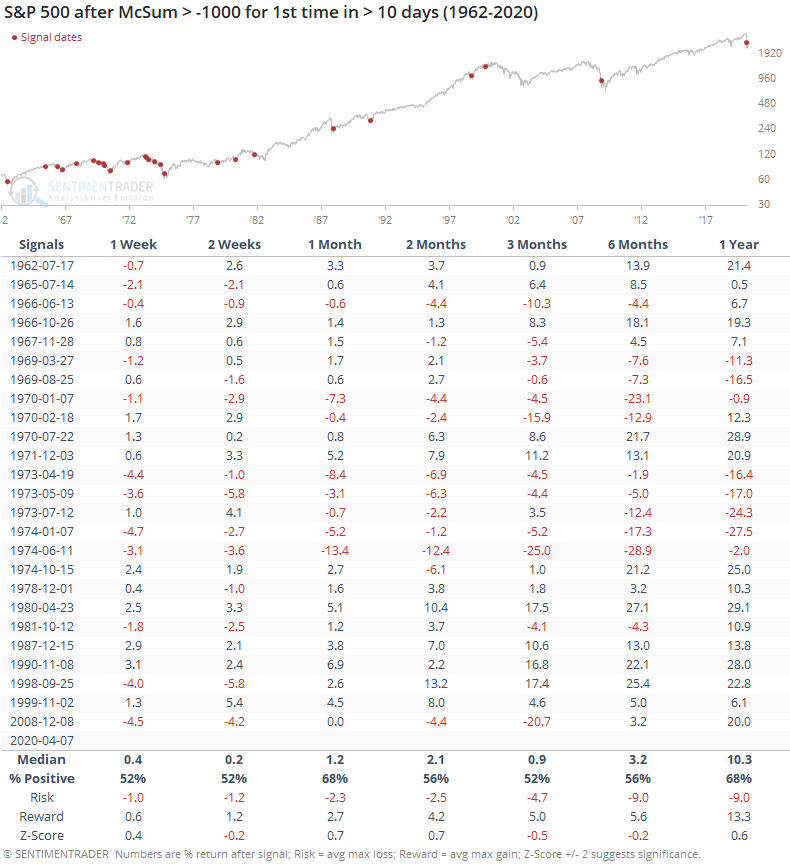
Similar recoveries led to a mixed bag of returns, especially in the 1970s.

 In recent decades, returns were much more consistently positive.

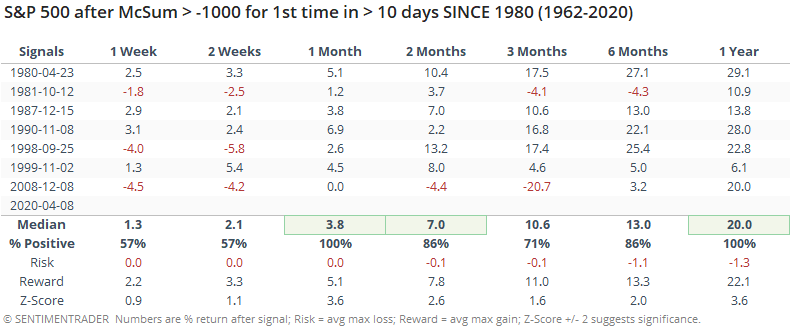
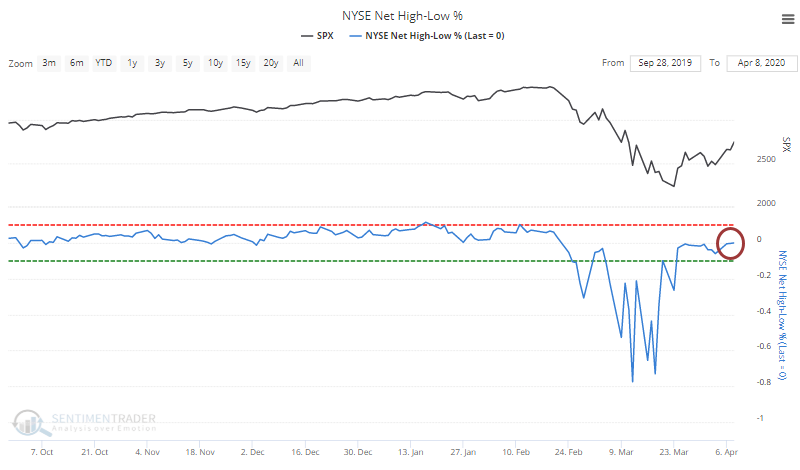
In March, we noted that 52-week lows were hitting rarely-seen or even record levels.

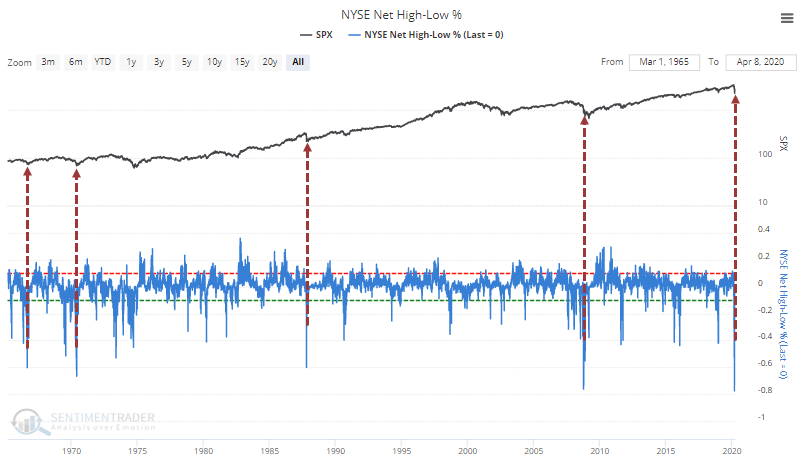
By Wednesday, there were finally more securities hitting 52-week highs than 52-week lows on the NYSE, reversing more than a month with more lows than highs.

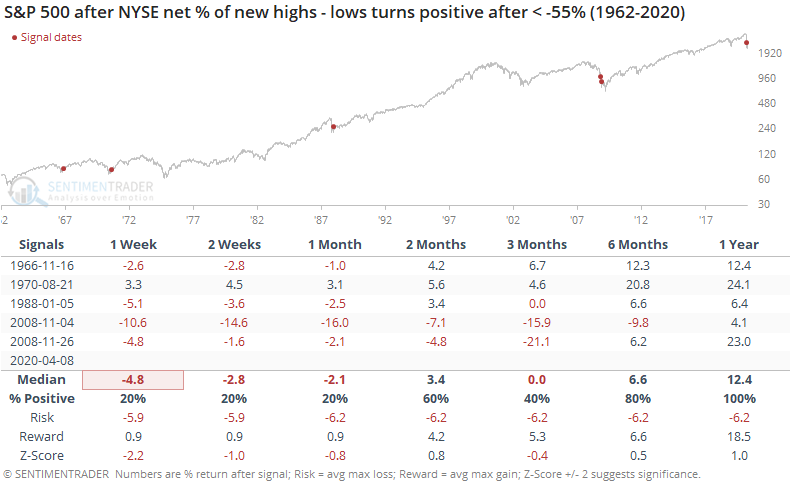
Similar recoveries preceded some short-term ugliness, but longer-term positive returns. A year later, the S&P was higher all five times. Those false starts in November 2008 were painful, though.

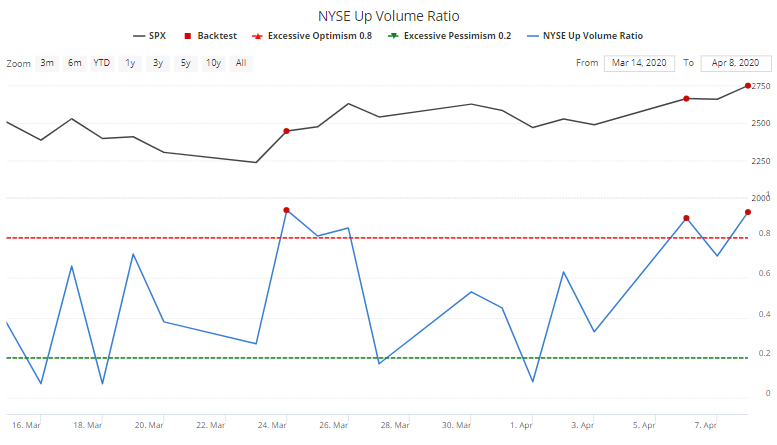
Several times over the past two weeks, we've looked at breadth thrusts as buyers returned to stocks in force (here and here and here). It's been the single most compelling aspect to this recovery, and it continued on Wednesday. Many analysts consider it important when more than 90% of NYSE volume flows into issues that advanced on the day. It's now done so twice in within 3 days.

Seeing multiple 90% Up Volume days so close to each has led to impressive returns, with an even more impressive risk/reward ratio.

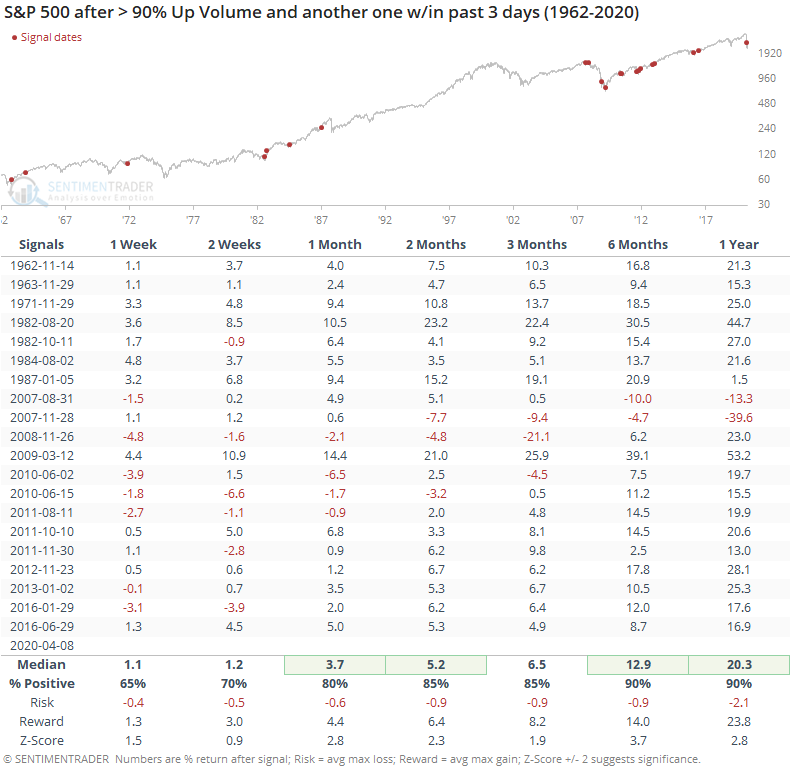
While we should always be skeptical of anything that claims to be perfect, when we've seen these double 90% days within a month of a 52-week low on the S&P 500, future returns were, indeed, perfect over the next 6-12 months. Those 1-year returns are stunning.

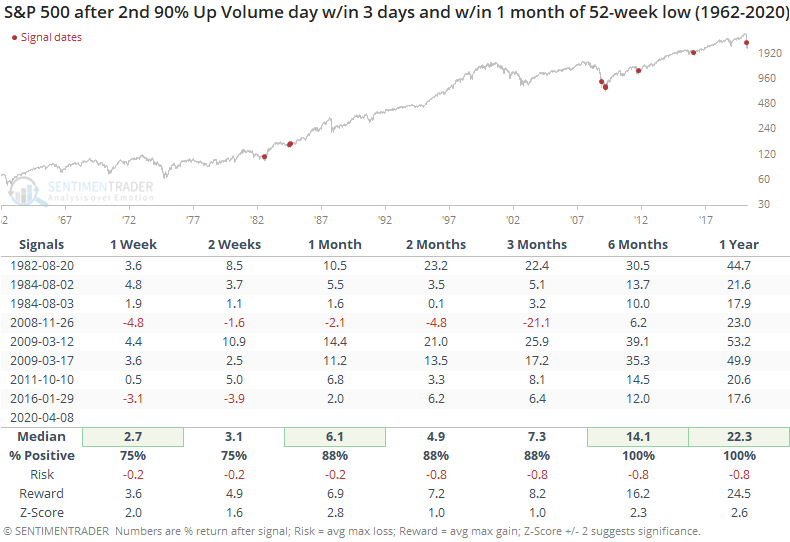
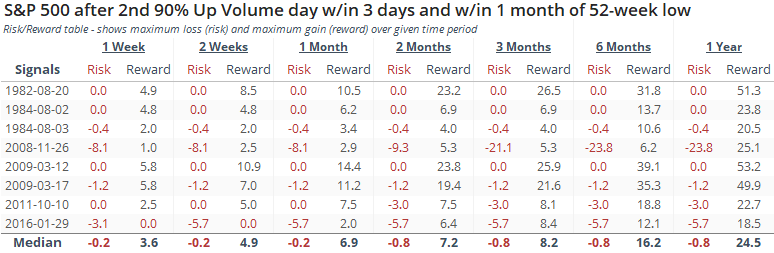
The risk/reward following these were excellent with the sole exception (and it was a big one) being November 2008.

Like we saw after times when sentiment recovered from deep pessimism, recoveries in breadth have preceded some heavy short-term volatility, usually meaning a drop over the next week or two.

The biggest mitigating factor - and it's been a factor for two weeks now - is the overwhelming thrust in buying pressure. Even if markets are being driven by algorithms making breath data less reliable, until these measures fail consistently they deserve attention. And nothing is screaming louder than these repeated days with huge buying interest. The short-term outlook is increasingly cloudy given the recoveries in so many indicators, but it's suggesting more and more that longer-term returns should be positive.

Sorry, you don't have access to this report

Upgrade your subscription plan to get access
Go to Dasboard
DATA &
TECHnologies
IndicatorEdge
‍
BackTestEdge
‍
Other Tools
‍
DataEdge API
RESEARCH
reports
Research Solution
‍
Reports Library
‍
actionable
Strategies
Trading Strategies
‍
Smart Stock Scanner
‍
FREE
RESOUrCES
Simple Backtest
Calculator
Simple Seasonality
Calculator
The Kelly Criterion
Calculator
Sentiment Geo Map
‍
Public Research Reports
‍
Free Webinar
COMPANY
‍
About
‍
Meet our Team
‍
In the News
‍
Testimonials
‍
Client Success Stories
Pricing
Bundle pricing
‍
Announcements
‍
FAQ
© 2024 Sundial Capital Research Inc. All rights reserved.
Setsail Marketing
TermsPrivacyAffiliate Program
Risk Disclosure: Futures and forex trading contains substantial risk and is not for every investor. An investor could potentially lose all or more than the initial investment. Risk capital is money that can be lost without jeopardizing ones’ financial security or life style. Only risk capital should be used for trading and only those with sufficient risk capital should consider trading. Past performance is not necessarily indicative of future results.

Hypothetical Performance Disclosure: Hypothetical performance results have many inherent limitations, some of which are described below. No representation is being made that any account will or is likely to achieve profits or losses similar to those shown; in fact, there are frequently sharp differences between hypothetical performance results and the actual results subsequently achieved by any particular trading program. One of the limitations of hypothetical performance results is that they are generally prepared with the benefit of hindsight. In addition, hypothetical trading does not involve financial risk, and no hypothetical trading record can completely account for the impact of financial risk of actual trading. for example, the ability to withstand losses or to adhere to a particular trading program in spite of trading losses are material points which can also adversely affect actual trading results. There are numerous other factors related to the markets in general or to the implementation of any specific trading program which cannot be fully accounted for in the preparation of hypothetical performance results and all which can adversely affect trading results.

Testimonial Disclosure: Testimonials appearing on this website may not be representative of other clients or customers and is not a guarantee of future performance or success.