Data &
Technology
Research
Reports
Report Solutions
Reports Library
Actionable
Strategies
Free
Resources
Simple Backtest Calculator
Simple Seasonality Calculator
The Kelly Criterion Calculator
Sentiment Geo Map
Public Research Reports
Free Webinar
Pricing
Company
About
Meet Our Team
In the News
Testimonials
Client Success Stories
Contact
Log inLoginSign up
< BACK TO ALL REPORTS

Breadth is breaking out

Jason Goepfert
2020-07-22
The Cumulative Advance/Decline Line has reached a new high for the first time in over a month. That's generally a good thing, though it becomes less so if the S&P 500, and the stocks-only A/D Line, are below their own highs at the time. Which they are now.

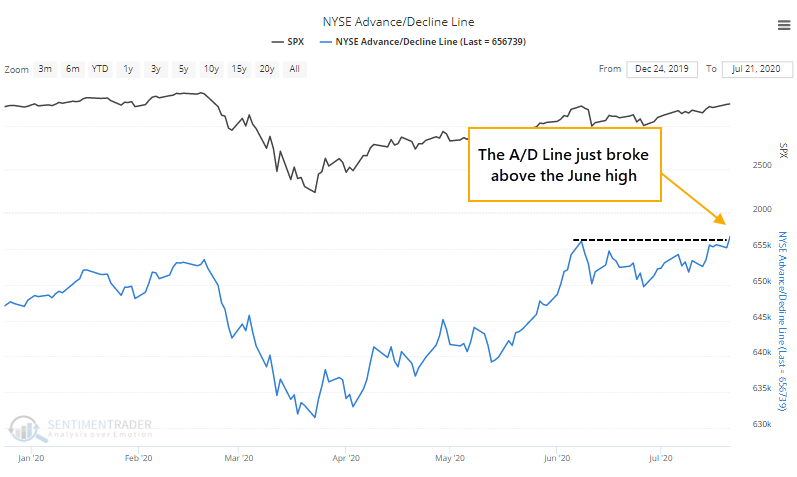
The NYSE Cumulative Advance/Decline Line has just broken out to a new high, exceeding its peak from June, which in turn exceeded the peak from February.

The line is constructed simply by adding each day's difference between the number of advancing and declining securities on the NYSE to the prior day's total. The more consistently we see more securities rising than falling, the higher the line will climb.

This is supposed to be a good sign, especially with major indexes not necessarily breaking out at the same time. If most securities are mostly rising, then it should eventually drag stocks higher.

Well, let's check. Below, we can see every time since 1940 when the S&P 500 was more than 3.5% below its own 52-week high as the Advance/Decline Line breaks out.

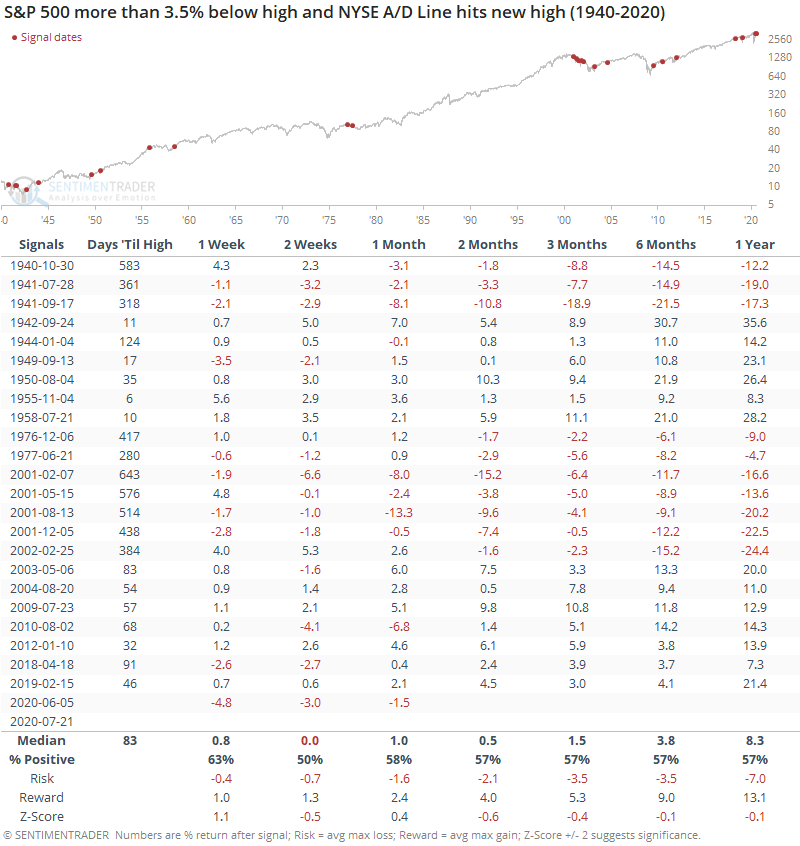
While it's always tempting to think that a breakout in the Advance/Decline Line is a sign that liquidity is plentiful and it's only a matter of time before the S&P gets pulled to a new high as well, it took a median of 83 trading days before it did so. Its forward returns were mediocre at best, with most time frames showing below-average results (a negative z-score) and an uninspiring risk/reward ratio.

It's clear that "something else" is driving the Advance/Decline Line besides just stocks - there are all kinds of securities that trade on the NYSE. And we can see from the High-Yield Bond Cumulative Advance/Decline Line that many rate-sensitive issues, of which there are many on the NYSE, have been doing well. This isn't a bad thing.

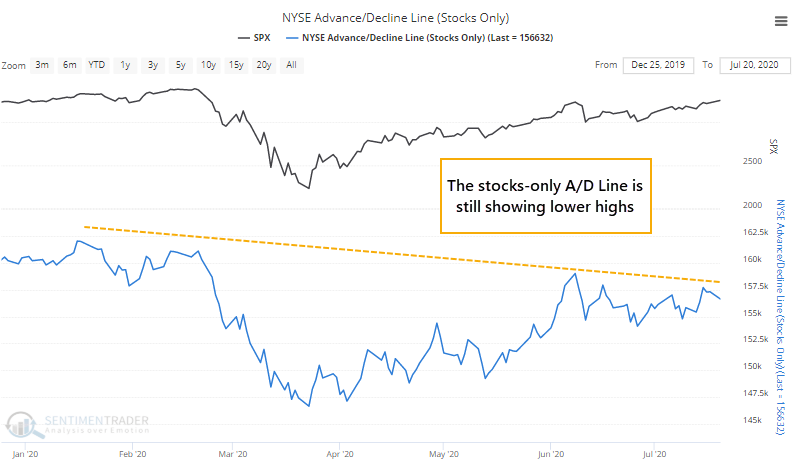
It's just a bit of a worry that the stocks-only line still hasn't broken out. Far from it. This line only includes common stocks, and excludes all the other "stuff" on the NYSE.

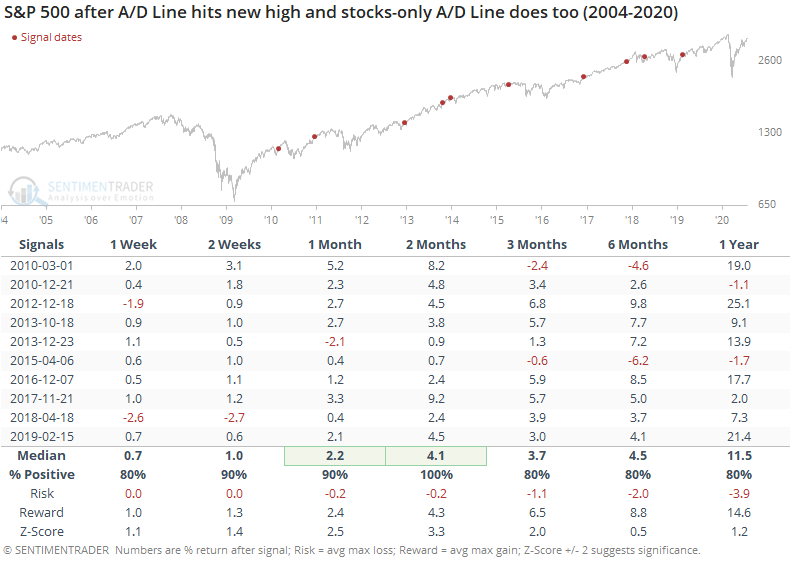
When the all-securities line breaks out for the first time in at least a month, but the stocks-only version lags behind, then the S&P's short-term forward returns were below average. The risk/reward was poor up to two months later.

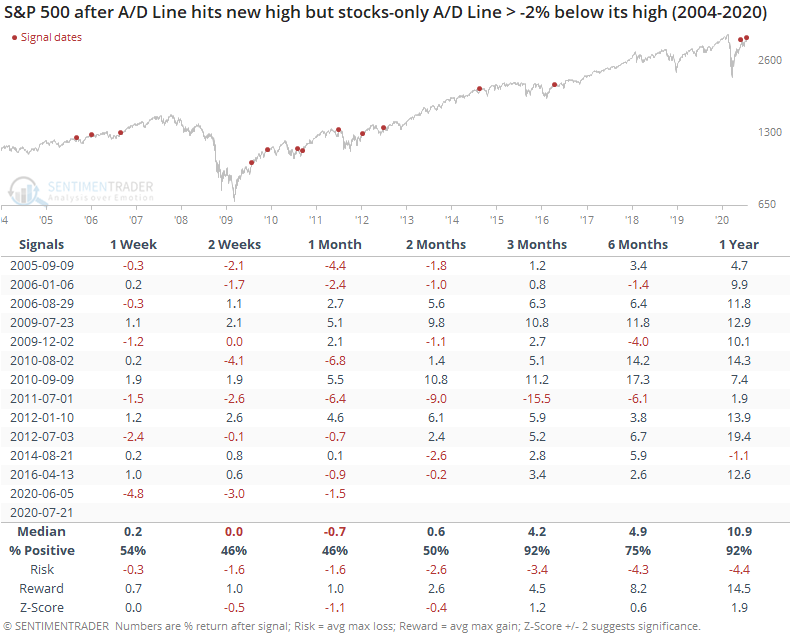
Contrast that to when both lines are at new highs together. Returns were much, much better, with minimal risk going forward.

The new high in the A/D Line is mostly a good thing, but it would be a much better thing if stocks (and the stocks-only A/D Line) were hitting new highs, too. Lags and divergences are generally not a good thing to see. There are also still a worryingly small number of stocks, industries, sectors, and countries trading above their 200-day averages. Healthy markets see these metrics rise, and hold, above 60%.

Even though the S&P is still several percentage points off its peak, one development that bulls might want to grasp onto is that the S&P 500 has turned positive year-to-date by nearly 1% for the first time in months. Seasonality isn't a help at this point, though, so when the index manages to come up for air at this point in the year, it hasn't been much help.

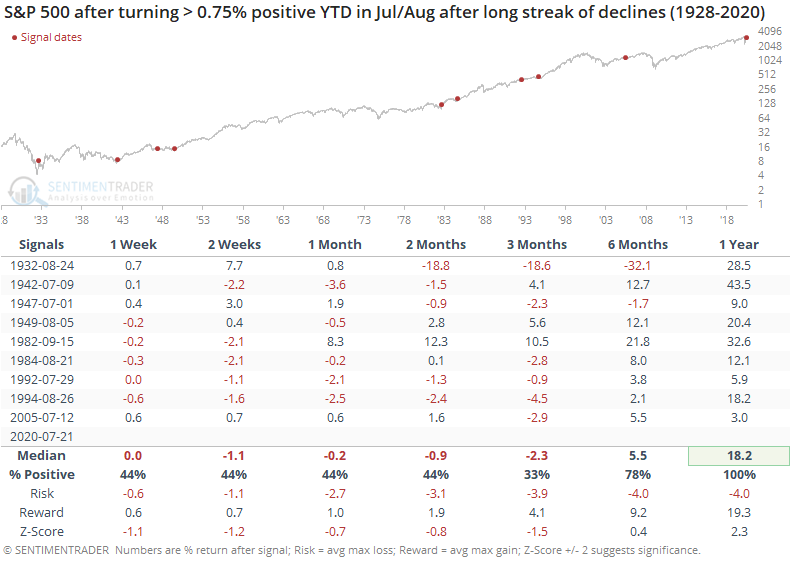
The short-term medium-term returns were very poor as stocks struggled through the rest of the summer months, as there wasn't much evidence of investors trying to chase the index higher. The 6-12 month returns, though, were quite good. 

Sorry, you don't have access to this report

Upgrade your subscription plan to get access
Go to Dasboard
DATA &
TECHnologies
IndicatorEdge
‍
BackTestEdge
‍
Other Tools
‍
DataEdge API
RESEARCH
reports
Research Solution
‍
Reports Library
‍
actionable
Strategies
Trading Strategies
‍
Smart Stock Scanner
‍
FREE
RESOUrCES
Simple Backtest
Calculator
Simple Seasonality
Calculator
The Kelly Criterion
Calculator
Sentiment Geo Map
‍
Public Research Reports
‍
Free Webinar
COMPANY
‍
About
‍
Meet our Team
‍
In the News
‍
Testimonials
‍
Client Success Stories
Pricing
Bundle pricing
‍
Announcements
‍
FAQ
© 2024 Sundial Capital Research Inc. All rights reserved.
Setsail Marketing
TermsPrivacyAffiliate Program
Risk Disclosure: Futures and forex trading contains substantial risk and is not for every investor. An investor could potentially lose all or more than the initial investment. Risk capital is money that can be lost without jeopardizing ones’ financial security or life style. Only risk capital should be used for trading and only those with sufficient risk capital should consider trading. Past performance is not necessarily indicative of future results.

Hypothetical Performance Disclosure: Hypothetical performance results have many inherent limitations, some of which are described below. No representation is being made that any account will or is likely to achieve profits or losses similar to those shown; in fact, there are frequently sharp differences between hypothetical performance results and the actual results subsequently achieved by any particular trading program. One of the limitations of hypothetical performance results is that they are generally prepared with the benefit of hindsight. In addition, hypothetical trading does not involve financial risk, and no hypothetical trading record can completely account for the impact of financial risk of actual trading. for example, the ability to withstand losses or to adhere to a particular trading program in spite of trading losses are material points which can also adversely affect actual trading results. There are numerous other factors related to the markets in general or to the implementation of any specific trading program which cannot be fully accounted for in the preparation of hypothetical performance results and all which can adversely affect trading results.

Testimonial Disclosure: Testimonials appearing on this website may not be representative of other clients or customers and is not a guarantee of future performance or success.