Breadth Flush Pt 2 - New Lows

The breadth flush today is getting more notable.
If the figures stand as they currently are into the close, then since 1940, only October 19, 1987 and August 8, 2011 will have seen more lopsided Up Volume over 1-day and 10-day periods.
New lows are climbing continually higher and it will not improve before the close (new low figures are calculated as of intraday lows so the figure can only get worse as the day progresses). Currently, 1,353 stocks have hit a new 52-week low, more than 42% of total issues.
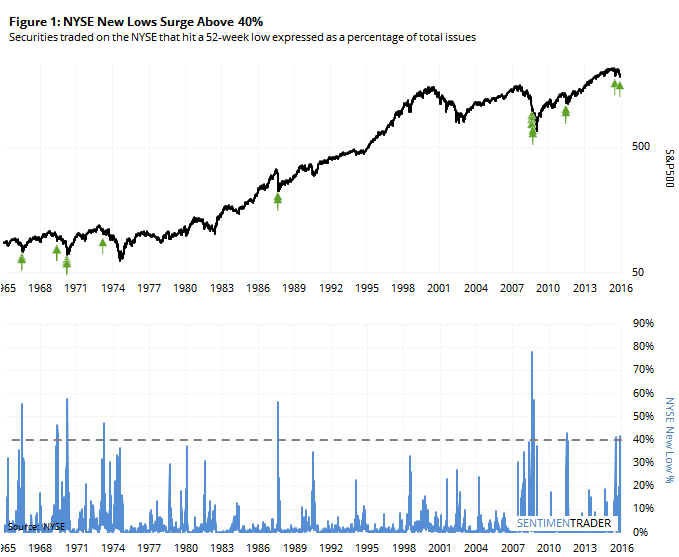
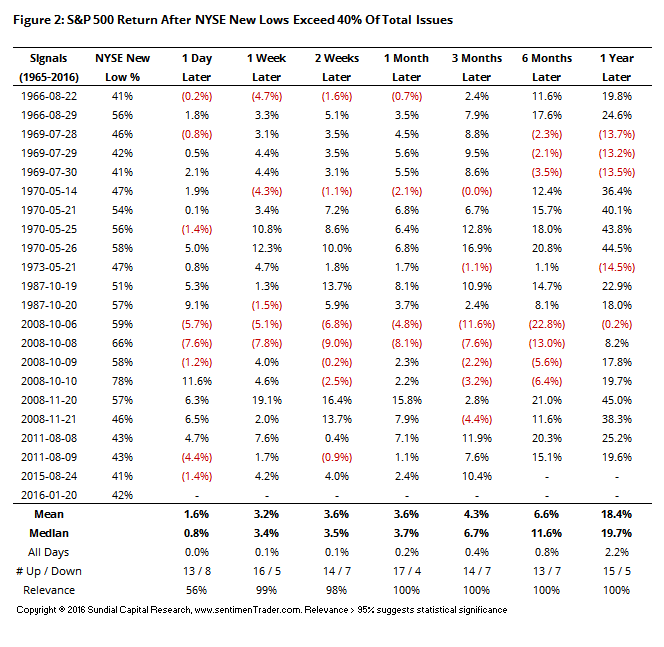
Figures 1 and 2 show every time since 1965, the furthest we can go back, when more than 40% of NYSE issues hit a 52-week low. With the exception of October 2008, even in the midst of bear markets these led to medium-term relief rallies.