
Breadth Breathes As A Bearish Candle Engulfs Oil

Breadth takes a breather
In January, breadth momentum was so impressive that the McClellan Oscillator held above 50 for over a month. Since then, it hasn’t climbed above that level even as stocks made great gains.
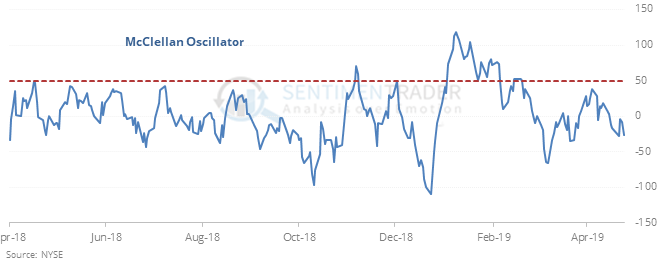
This is a divergence that has triggered near several important market peaks, but the lead time was long and there were too many false positives. Looking at the chart, there could be cause for worry. This condition triggered at or near major peaks in 1965, 1971, 1980, 1987 (!), 1999, and 2007. Only the 1987 signal, which triggered right before stocks started to slide into the fall crash, showed consistent and large losses.
It’s not only the Oscillator for the NYSE, either. Across sectors and on the Nasdaq exchange, the indicator has been unable to get back above 50 despite tremendous gains in some of the indexes, but again with a mixed record at preceding losses.
Bearish candle engulfs crude oil
On a weekly price chart, a Bearish Engulfing Candle triggered in crude oil.
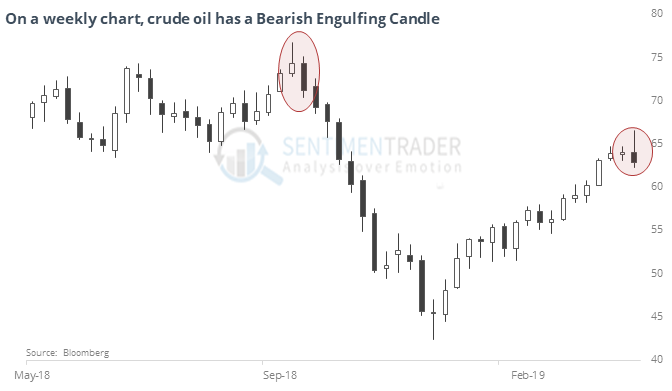
For those who pay attention to such things, this suggests risk is high. Based on how crude reacted in the past, there is some support for that idea. Especially with some other factors that have lined up.
The latest Commitments of Traders report was released, covering positions through Tuesday
The 3-Year Min/Max Screen shows that “smart money” hedgers hit a new high in VIX futures. They also continue to add to (losing) positions in grains like corn and soybeans. Over the past 5 years, the Backtest Engine shows that positions as large as this in corn led to gains every time over the next 2 months, averaging nearly 10%. Same with beans. They also picked up their buying in commodity-related currencies like the Canadian and Aussie dollars.
This post was an abridged version of our previous day's Daily Report. For full access, sign up for a 30-day free trial now.