
Breadth alerts continue to favor the bullish case

Breadth reaches a negative extreme when enough investors give up and sell aggressively enough to force an oversold situation. Sometimes the market reverses immediately. Other times it can take quite a while for a bottom to form. Regardless, it is time to keep an open mind regarding the bullish case for stocks when the market reaches oversold.
Key Points
- The macro/big picture outlook remains a question market with high inflation, rising interest rates, a downtrend in price action, and a weakening economy
- Nevertheless, a wide variety of sentiment and breadth indicators - along with favorable seasonality and improved insider activity - tell us to remain open to the possibility that the recent stock market bounce may turn into a meaningful rally
- In this piece, we highlight a range of breadth indicators that gave favorable signals following the June low
14-day RSI performance for S&P 1500 reached oversold
The chart and table below display the S&P 500 Index performance after the percentage of S&P 1500 Index stocks with a 14-day RSI reading below 30% crossed above 38 for the first time in three months.
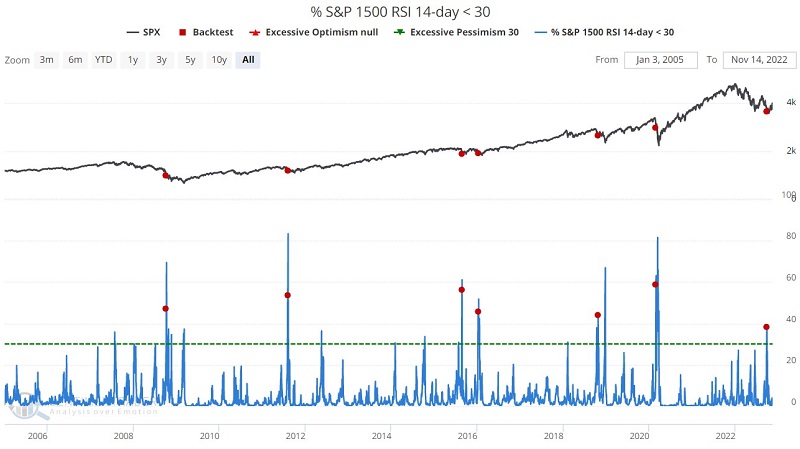
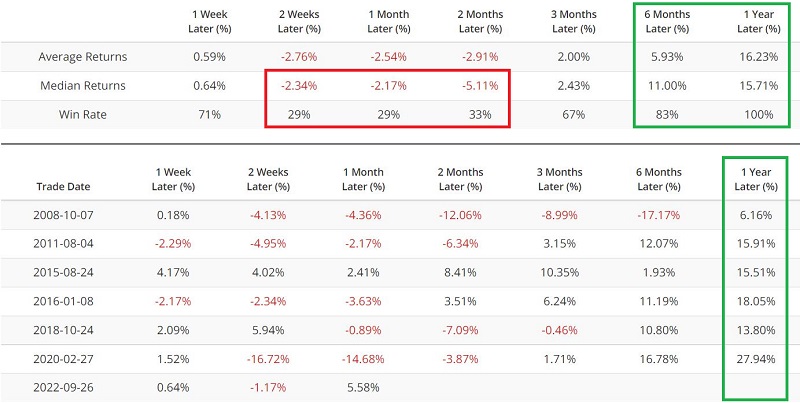
The key things to note are:
- The relatively poor performance during the first two months after a new signal
- The consistently favorable performance after the first two months
The most recent signal occurred on 2022-09-26, suggesting the potential for better days ahead between late November and September 2023.
2-day RSI performance for S&P 1500 also hit oversold territory
The chart and table below display the S&P 500 Index performance after the percentage of S&P 1500 Index stocks with a 2-RSI reading below 30% crossed above 95 for the first time in three months.
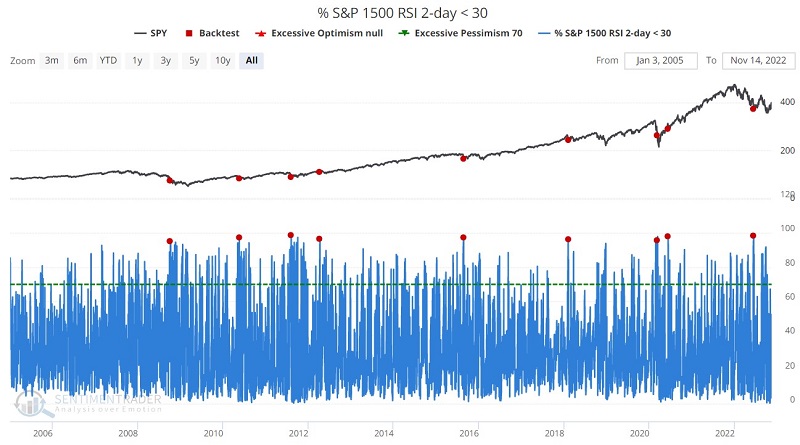
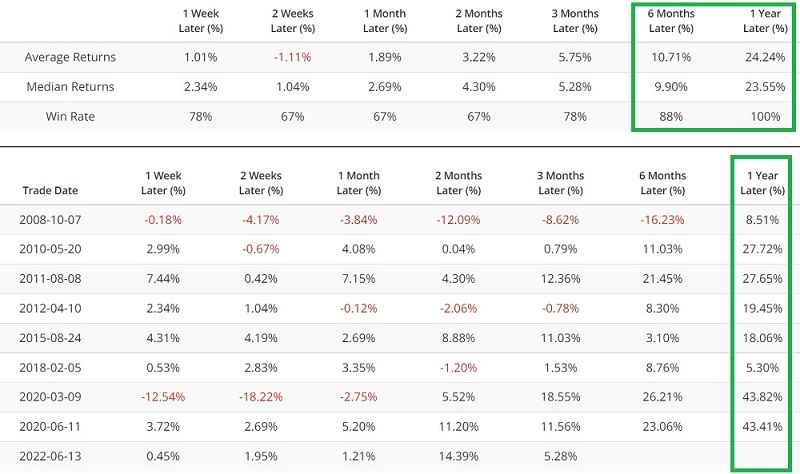
The key thing to note is that historically gains have tended to accelerate between three and twelve months after a signal. The most recent signal occurred on 2022-06-13, suggesting better days between now and mid-June 2023.
Widespread oversold conditions among S&P 500 constituent stocks
The chart and table below display S&P 500 Index performance after the percentage of S&P 500 Index stocks above their respective 50-day moving average drops below 5%.
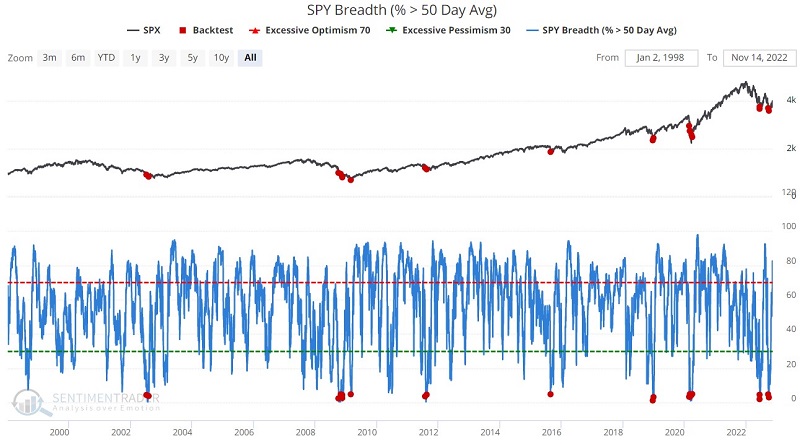
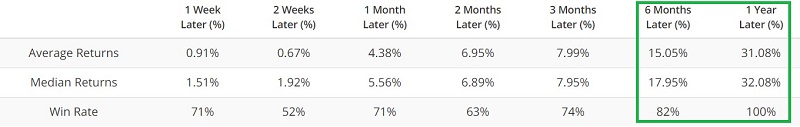
This indicator tends to be "early" and to generate multiple signals as a bottom is forming (2002, 2008, 2011, 2020, and four separate signals in June and September 2022). Like the indicators above, this one is perhaps not so much a "buy signal" as it is a "get ready to buy signal." With signals on 2022-06-13, 2022-06-15, 2022-09-23, and 2022-09-30, this indicator implies that a meaningful market advance may be at hand.
Small-caps versus the 200-day average have also flashed alert signals
The chart and table below display the iShares Russell 2000 ETF (ticker IWM) performance following all day when the 10-day average of the percentage of Russell 2000 Index stocks above their respective 200-day moving average was below 20%.
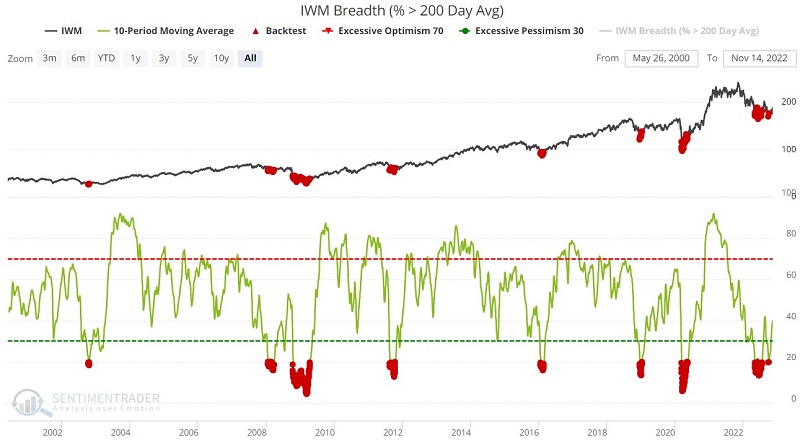
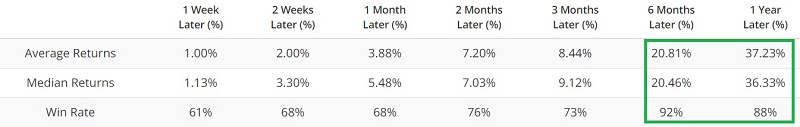
This indicator also tends to be early and typically generates a grouping of signals as the market forms a bottom.
The indicator below cuts a little finer and looks only at those days when the percentage of Russell 2000 Index stocks above their respective 200-day moving average crossed below 14% for the first time in three months.
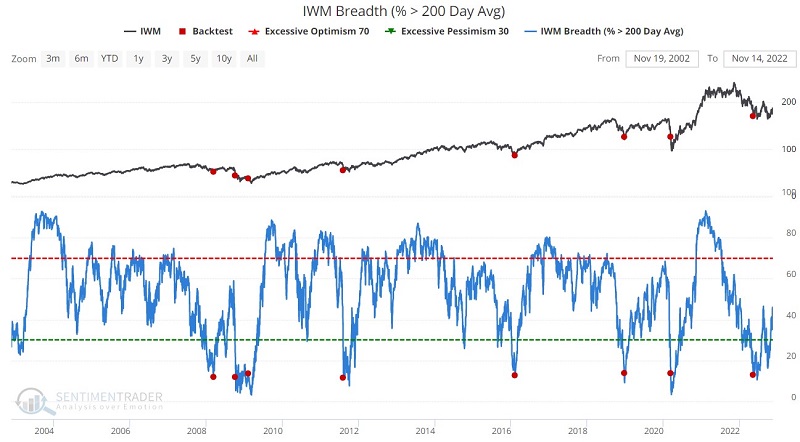
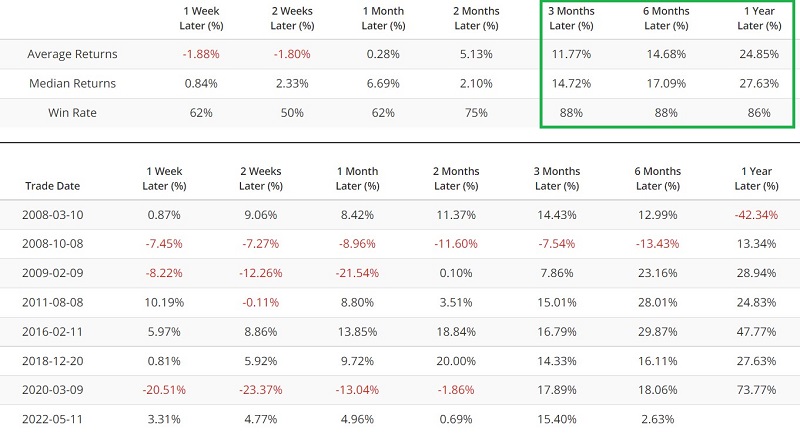
The signals in 2008 were early and followed by significant price weakness. Some highly robust returns have followed the signals since that time. It is interesting to note that the most recent signal occurred on 2022-05-11. Most people would perceive that signal to be "too early." Yet the reality is that IWM is up over +5% since that time.
What the research tells us…
A trader might use any indicator signals above as an actionable buy signal. However, not every indicator is intended to be used as a standalone trading model. The real purpose of indicators like those above is to identify potential inflection points, i.e., where enough extreme movement has occurred to set the stage for a reversal. Unfortunately, history tells us that reversals can sometimes take time to form and play out. Nevertheless, the above signals have a history of being followed by higher stock prices six to twelve months later.