Data &
Technology
Research
Reports
Report Solutions
Reports Library
Actionable
Strategies
Free
Resources
Simple Backtest Calculator
Simple Seasonality Calculator
The Kelly Criterion Calculator
Sentiment Geo Map
Public Research Reports
Free Webinar
Pricing
Company
About
Meet Our Team
In the News
Testimonials
Client Success Stories
Contact
Log inLoginSign up
< BACK TO ALL REPORTS

Brazilian Stocks Showing Washout Breadth

Jason Goepfert
2021-08-18
Recent selling pressure in Brazilian stocks has triggered extremes in a number of breadth indicators for the Ibovespa index.

Brazilian stocks have been getting smoked since June. The Ibovespa is down about 10% from its peak, while the EWZ fund traded in the U.S. and priced in dollars is down more than 15%.

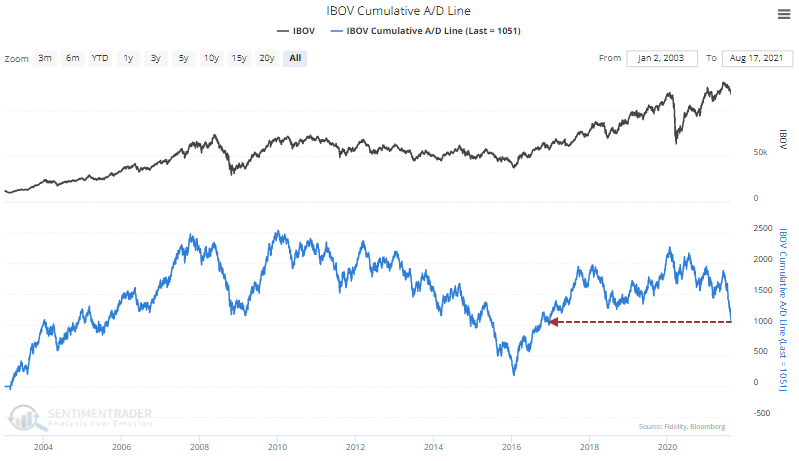
The Ibovespa is kind of like the Nasdaq in that its Cumulative Advance/Decline Line has a bugger of a time consistently rising. Apparently, quite a few crappy stocks dragging down the averages. With its latest plunge, the A/D Line for that index is at its lowest point in 5 years.

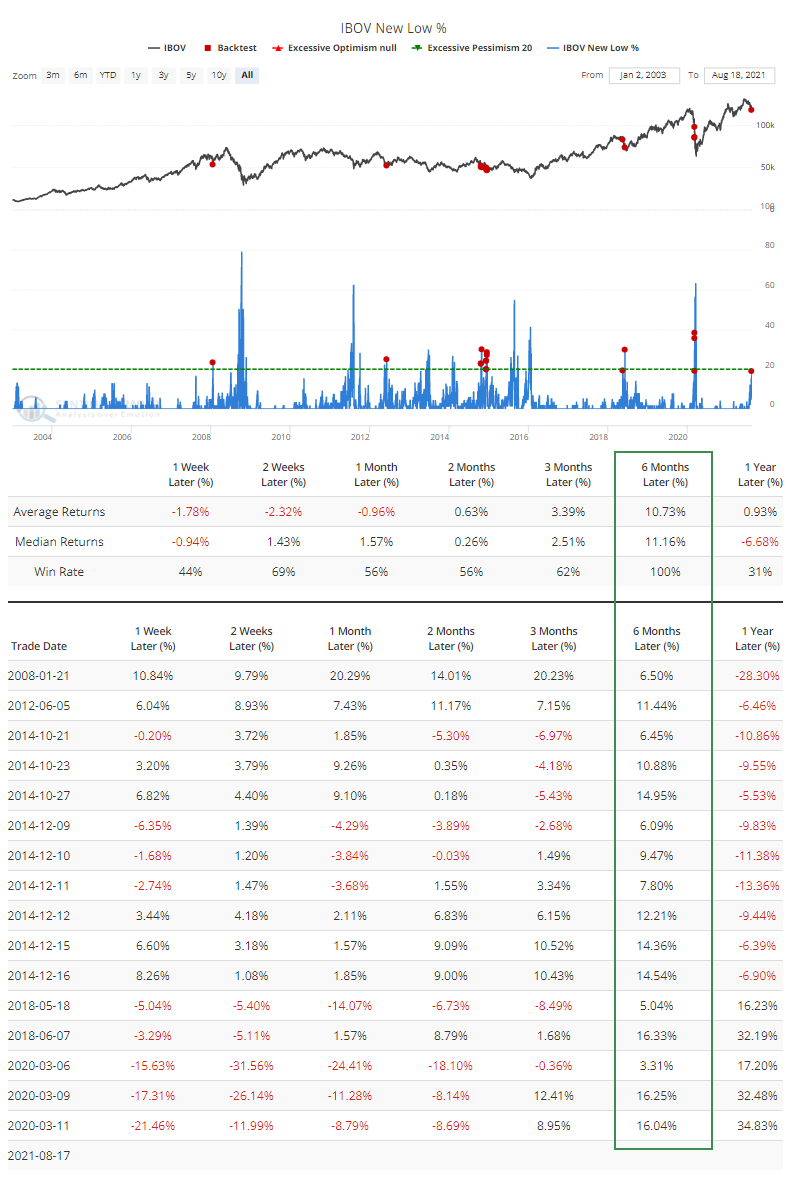
This has started to generate some extremes. Nearly 20% of stocks in the Ibovespa fell to a 52-week low this week. Using the Backtest Engine to look for readings this high when the 200-day moving average is rising, it preceded gains in the Ibovespa over the next 6 months every time. The pandemic crash was uncomfortable, for sure.

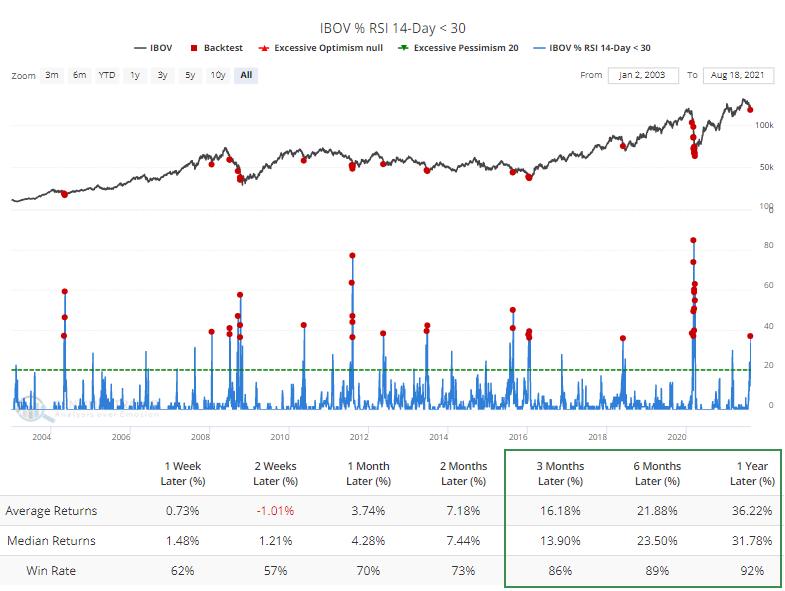
The latest puke-fest triggered an oversold reading in more than 35% of the stocks. Once again, the Engine shows few losses over a medium- to long-term time frame.

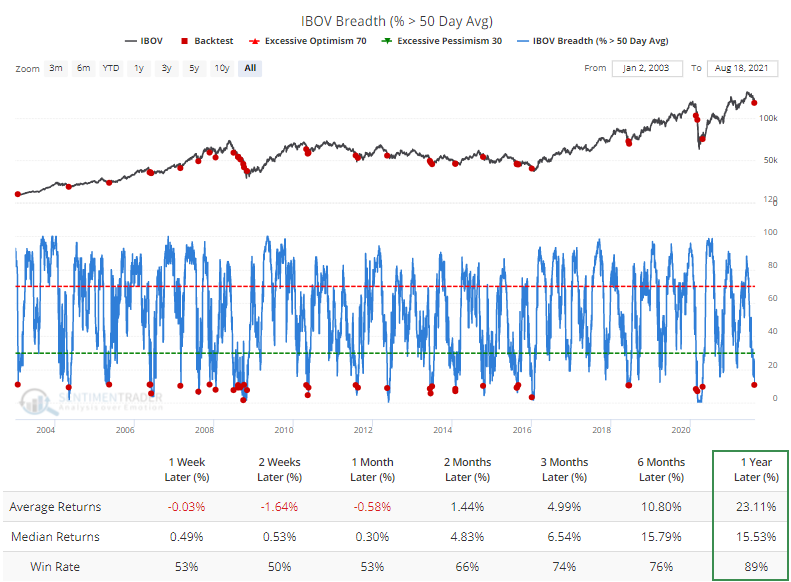
Some of the medium-term trend indicators are showing moderate extremes, with the percentage of stocks above their 50-day moving averages falling below 11%. Not great short-term returns, but good long-term ones, per the Backtest Engine.

Here's the kicker - the recent internal momentum has been so poor that the McClellan Summation Index for the Ibovespa dove below -1300, one of the worst readings we've seen. The Engine shows no losses over the following year, with a whopping average return of +42%.

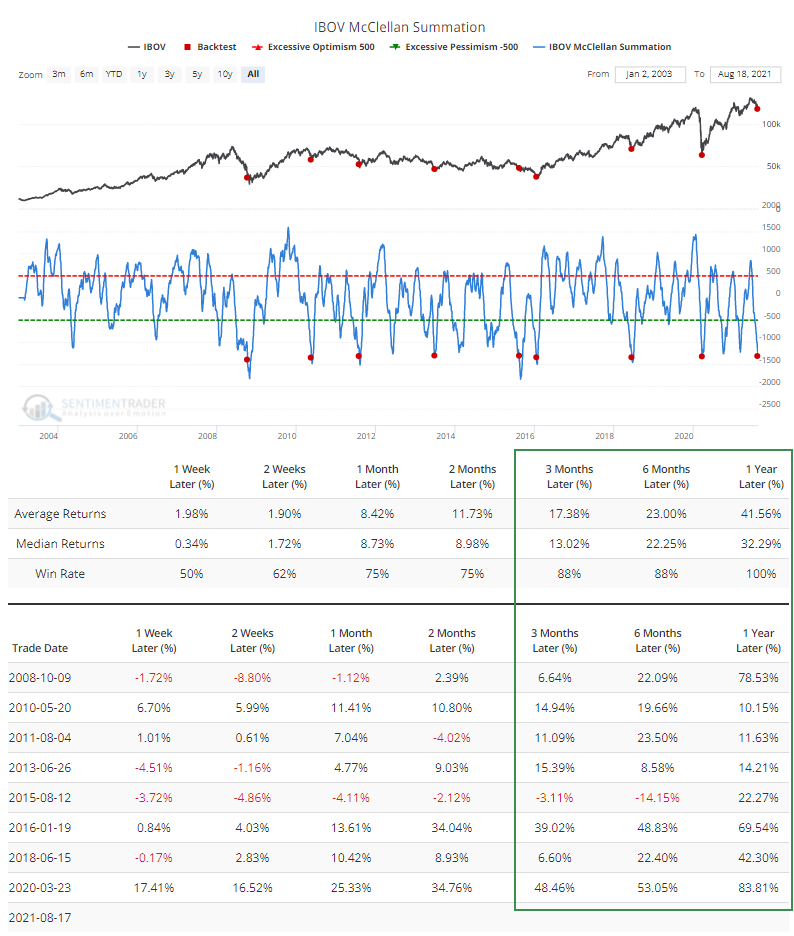
Ideally, we'd see a quick spike in 52-week lows to 40%+ of all issues, and then a rebound. That has marked the largest lows, but also came after much greater losses. For intermediate-term declines, the current extremes are about as egregious as it gets. The Summation Index extreme is compelling for those looking for longer-term opportunities.

DATA &
TECHnologies
IndicatorEdge
‍
BackTestEdge
‍
Other Tools
‍
DataEdge API
RESEARCH
reports
Research Solution
‍
Reports Library
‍
actionable
Strategies
Trading Strategies
‍
Smart Stock Scanner
‍
FREE
RESOUrCES
Simple Backtest
Calculator
Simple Seasonality
Calculator
The Kelly Criterion
Calculator
Sentiment Geo Map
‍
Public Research Reports
‍
Free Webinar
COMPANY
‍
About
‍
Meet our Team
‍
In the News
‍
Testimonials
‍
Client Success Stories
Pricing
Bundle pricing
‍
Announcements
‍
FAQ
© 2024 Sundial Capital Research Inc. All rights reserved.
Setsail Marketing
TermsPrivacyAffiliate Program
Risk Disclosure: Futures and forex trading contains substantial risk and is not for every investor. An investor could potentially lose all or more than the initial investment. Risk capital is money that can be lost without jeopardizing ones’ financial security or life style. Only risk capital should be used for trading and only those with sufficient risk capital should consider trading. Past performance is not necessarily indicative of future results.

Hypothetical Performance Disclosure: Hypothetical performance results have many inherent limitations, some of which are described below. No representation is being made that any account will or is likely to achieve profits or losses similar to those shown; in fact, there are frequently sharp differences between hypothetical performance results and the actual results subsequently achieved by any particular trading program. One of the limitations of hypothetical performance results is that they are generally prepared with the benefit of hindsight. In addition, hypothetical trading does not involve financial risk, and no hypothetical trading record can completely account for the impact of financial risk of actual trading. for example, the ability to withstand losses or to adhere to a particular trading program in spite of trading losses are material points which can also adversely affect actual trading results. There are numerous other factors related to the markets in general or to the implementation of any specific trading program which cannot be fully accounted for in the preparation of hypothetical performance results and all which can adversely affect trading results.

Testimonial Disclosure: Testimonials appearing on this website may not be representative of other clients or customers and is not a guarantee of future performance or success.