
Brazil joins the breadth thrust party

Key points:
- Several market breadth indicators for the Brazilian Ibovespa Index surged in the last week
- The broad-based participation looks more indicative of conditions found in uptrends versus downtrends
- Similar breadth-based signals preceded excellent returns and win rates a year later
The global market environment
The global investment landscape has been challenging, especially if one allocated money to an Index-based ETF like EEM or ACWI. While resource-based countries have been absolute and relative winners, they finally succumbed to the hostile market environment with some severe drawdowns into lows in June and July.
In the last week, some bullish signals have started to pop up for a few emerging market countries. In a recent note, I shared a thrust signal for India, and now Brazil has joined the party with several breadth-based thrust alerts.
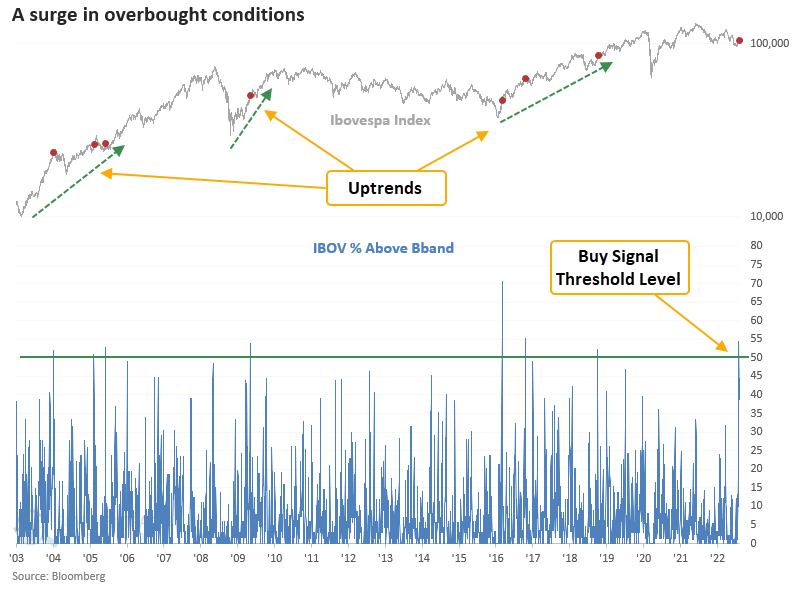
A surge in market breadth indicators suggests a potential trend change
Ibovespa Index members trading above their upper Bollinger band surged to the third highest level in history last week. Historically, an increase of this magnitude only occurs in uptrends. So, could the new signal foreshadow a potential trend change?
Let's assess the outlook for the Ibovespa Index after the number of members trading above their upper Bollinger band exceeds 50%.
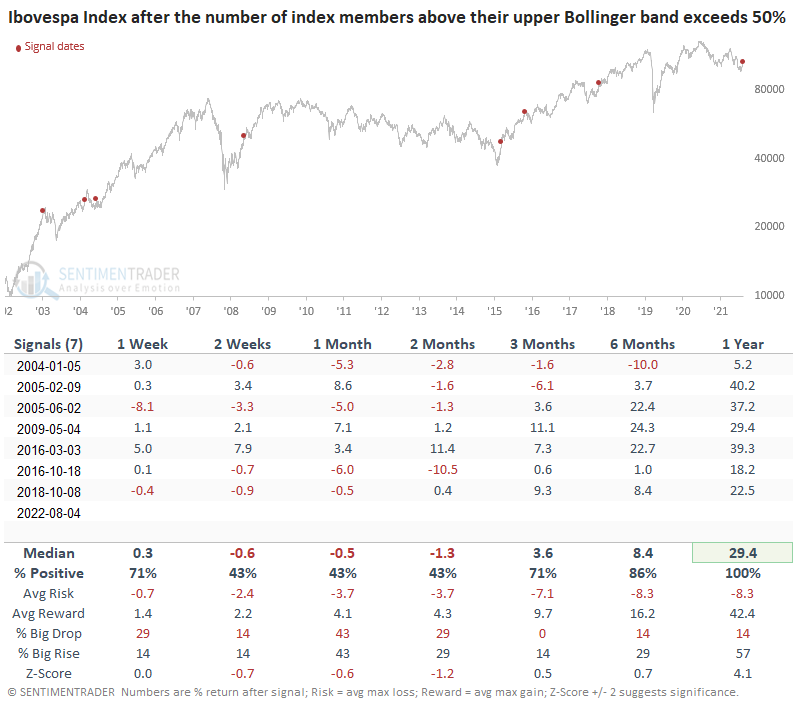
Similar signals preceded gains 100% of the time a year later
This market breadth indicator generated a signal seven other times over the past 18 years. The near-term picture looks unfavorable as the Ibovespa tends to work off the overbought condition. A year later, the signal shows a perfect record. The odds of a potential trend change look compelling.
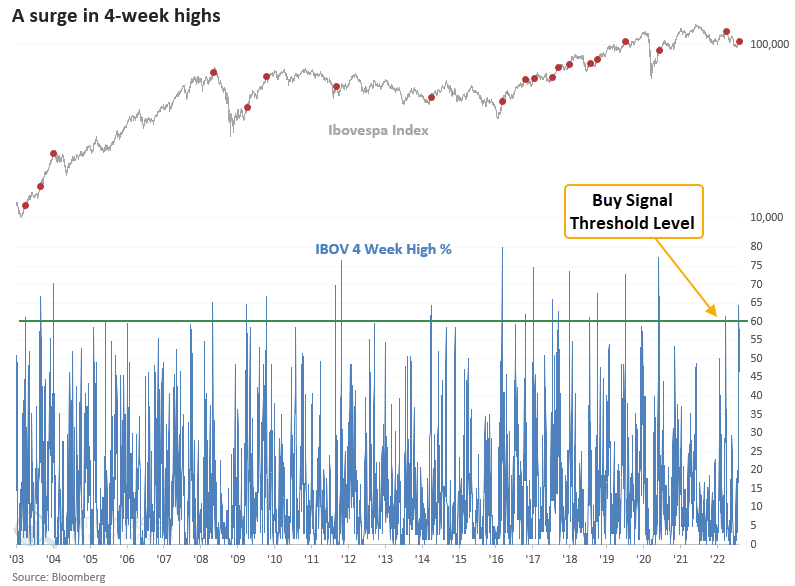
Ibovespa Index members registering a 4-week high surged above 64% last week. Typically, an increase above 60% only occurs in uptrends or at the outset of a multi-month countertrend move.
Let's assess the outlook for the Ibovespa Index after the number of Index members registering a 4-week high exceeds 60%.
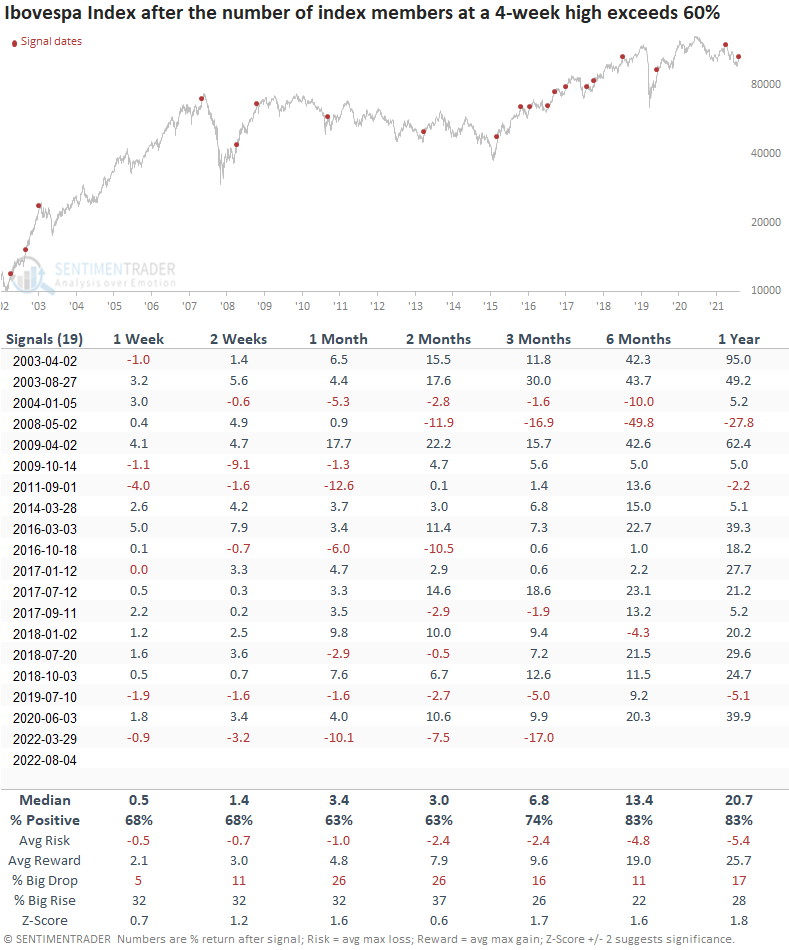
Similar signals preceded gains 83% of the time 6 & 12 months later
This market breadth indicator generated a signal 19 other times over the past 19 years. Forward returns, win rates, and z-scores look favorable, especially in the six and 12-month periods. The signal is not infallible as it had two unfortunate alerts within the context of a bear market bounce. The most recent one occurred in March of this year.
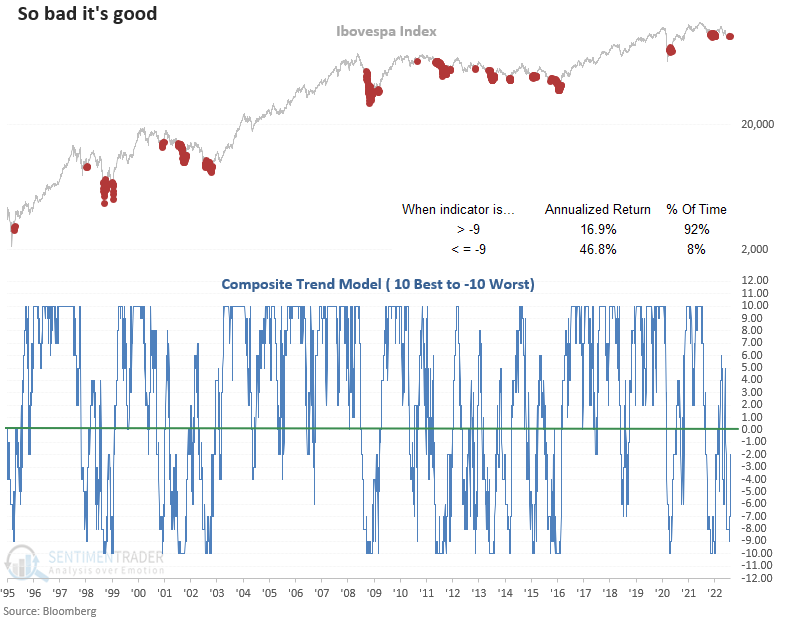
The absolute price trend score improved from a low level
If I apply the Ibovespa Index to my composite trend model, the trend score showed a reading of negative nine as recently as 7/28/22. While rare, annualized returns are significantly better when the composite maintains a highly unfavorable score. i.e., So bad it's good.
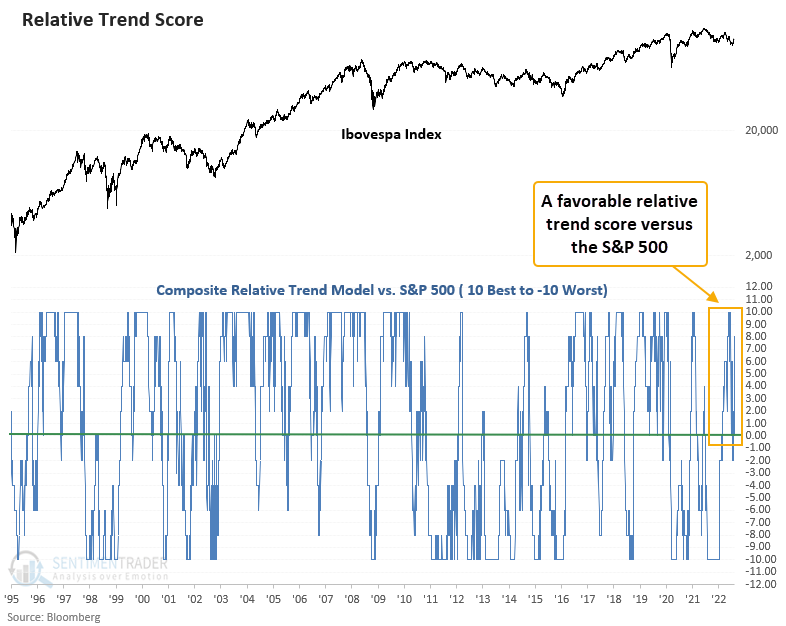
Relative price trend score versus the S&P 500
Suppose I apply the Ibovespa Index to my composite relative trend score model and compare it to the S&P 500. In that case, we see a surge in the relative trend score to a positive eight. So, the Ibovespa Index looks better relative to the world's most watched benchmark.
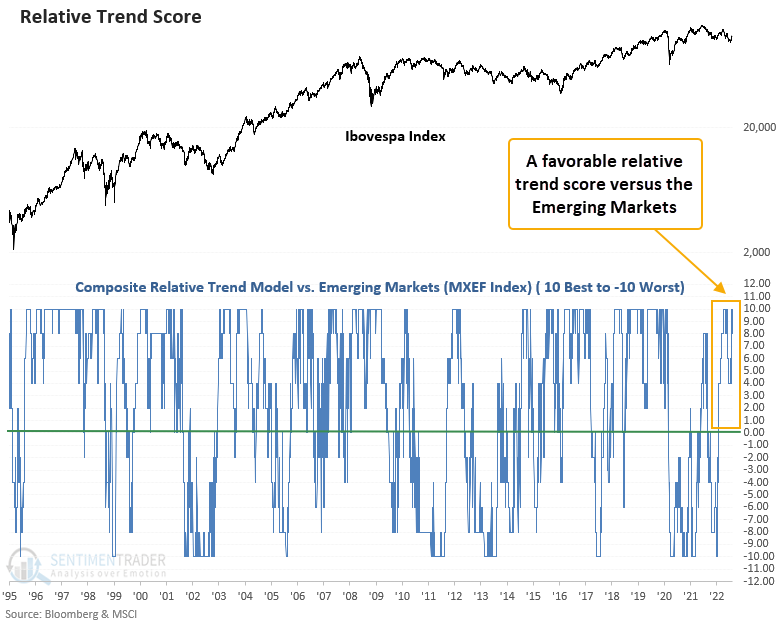
Relative price trend score versus Emerging Markets
The Ibovespa Index has been a relative winner versus the MSCI Emerging Markets Index for most of 2022. The recent thrust signals have moved the relative trend score to a perfect ten.
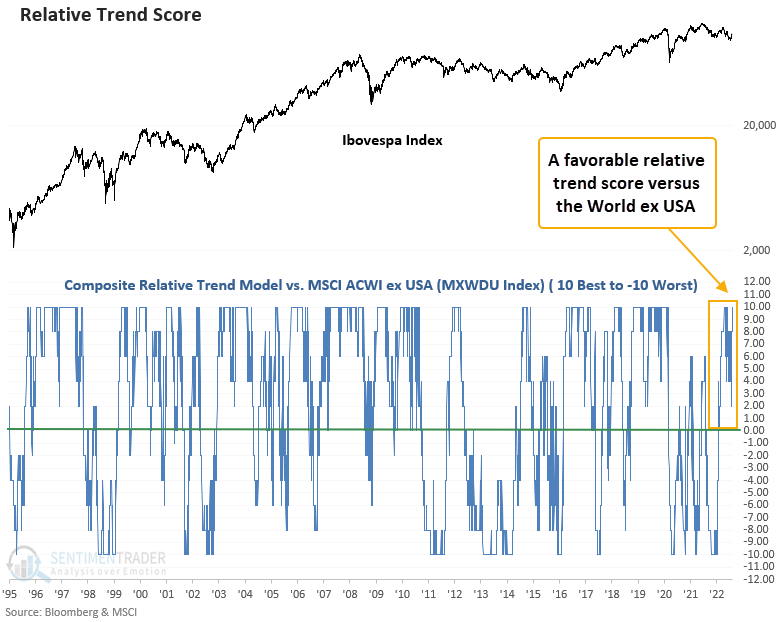
Relative price trend score versus the World ex USA
If we compare the Ibovespa Index to the MSCI ACWI ex USA, the relative trend score jumped to ten on the back of the new thrust signals. Brazil looks favorable versus a widely followed global benchmark.
What the research tells us...
Breadth-based thrust signals are one of the best indicators to identify a potential index trend reversal from a bear market. The high level of participation is typically a bullish barometer for future Index gains. With multiple thrust signals occurring in the last week, one should be mindful that Brazil could be transitioning to a new cyclical uptrend.