Products
SentimenTrader Trading Tools
‍
Backtest Engine
My Trading Toolkit
Correlation Analysis
Seasonality
Market Prediction
Indicators & Data API
‍
Proprietary Indicators & Charts
Market Data API
Strategies & Scanner
‍
50+ Trading Strategies
Smart Stock Scanner
Smart Option Scanner
Research Reports
‍
Research Solutions
Reports Library
Free Resources
Simple Backtest Calculator
Simple Seasonality Calculator
The Kelly Criterion Calculator
Sentiment Geo Map
Public Research Reports
Education
Sentiment Indicators
Technical Indicators
Pricing
Company
About
In the News
Testimonials
Client Success Stories
Contact
Log inLoginSign up
< BACK TO ALL REPORTS

Both Smart and Dumb Money are pretty bullish

Jason Goepfert
2024-07-01
More oddities are occurring with sentiment as stocks rally. Smart Money Confidence has increased even as stocks jumped, which is highly unusual. Both Smart and Dumb Money Confidence are at high levels at the same time. When "everyone" was bullish, stocks struggled up to a few months later, though it was inconsistent.

Key points:

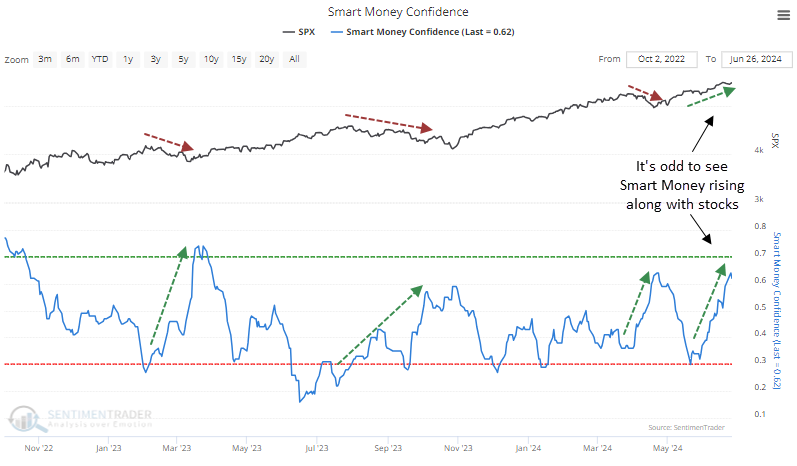
  • Smart Money Confidence jumped even as stocks rallied, which is the opposite of typical behavior
  • Both Smart and Dumb Money Confidence are above 60%, another oddity
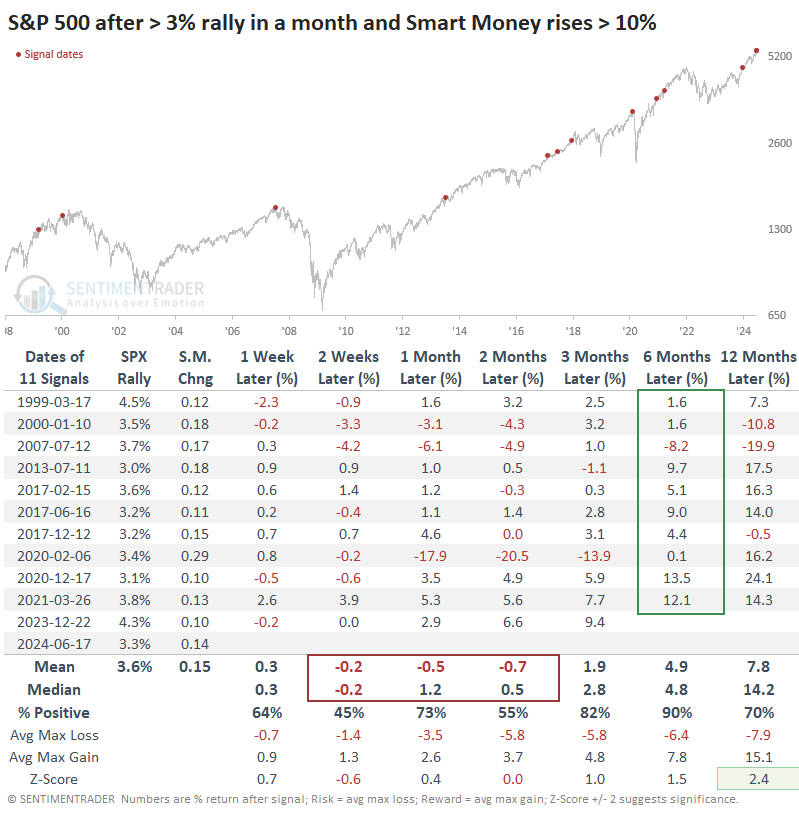
  • S&P 500 returns after similar behavior was inconsistently weak over the next couple of months

More odd behavior

Optimism has been ebbing lately. That may seem like good news for contrarians - the "wall of worry" and all that nonsense - but we saw last week that bull markets need more bulls, not fewer.

Among the several oddities happening in technicals right now is that sentiment is acting rather oddly. Dumb Money Confidence has been stagnant, but Smart Money Confidence is rising. This model comprises data that mainly reflects institutional activity, and institutions most often buy as stocks decline and vice-versa.

It's strange to see Smart Money rise by 10% or more during a month when the S&P 500 rose significantly. The table below shows that other times it happened, the S&P showed uninspired returns up to two months later, though the last few signals were excellent. By six months later, the index suffered only a single loss (but that was the global financial crisis).

Is everyone pretty bullish?

Because Smart Money has been rising and Dumb Money is still high, both models are above the 60% confidence level at the same time. This, too, is highly unusual.

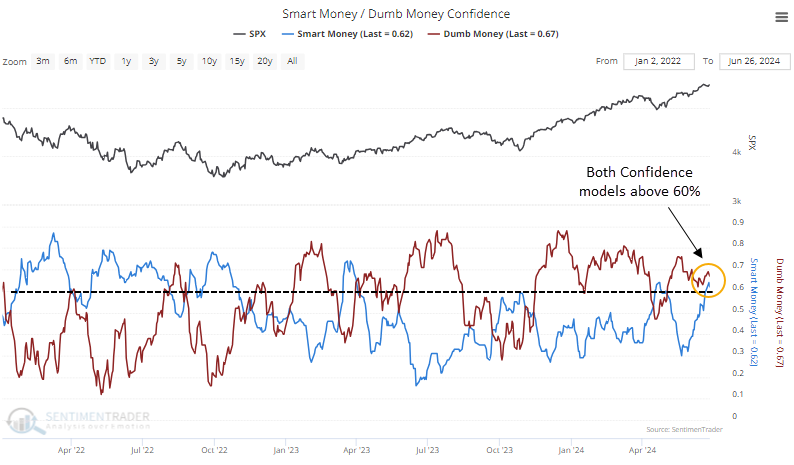
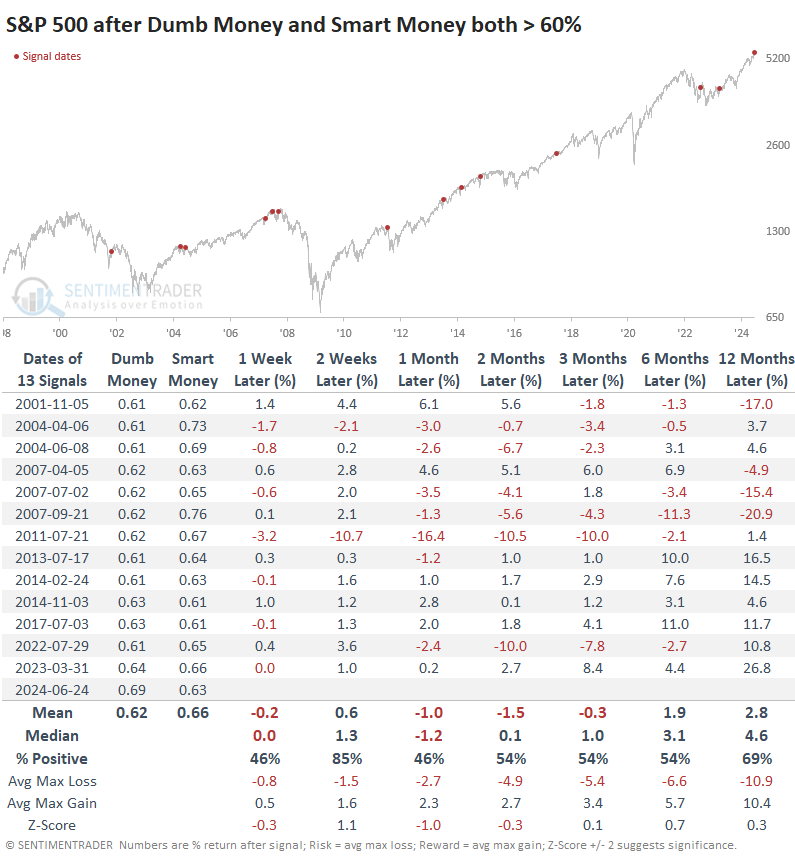
Since the models' inception in 1998, this is the highest Smart Money Confidence reading when Dumb Money was above 65%. If we relax the parameters to 60%, we get the results in the table below.

Again, returns weren't all that great. Up to three months later, the mean return was negative, and the median was just barely positive. Risk outweighed reward across time frames, even up to a year later, even though the win rate improved. The last few signals all ultimately showed double-digit gains a year later, though two of those were triggered when stocks were well off their highs.

What the research tells us...

We don't like "odd." It's better when markets do what they should be doing, and investors behave like they should be behaving. That's been the case, with few exceptions, since the fall of 2022. It started to change in January of this year and quickly corrected itself. Then, about a month ago, we began to see oddities pile up in a more worrisome manner, and it continues today.

Most of the concerns we've discussed are more intermediate, ranging from weeks to months. Most haven't seen consistently weak results extend much beyond a few months, so long-term concerns are still relatively few and minor so far. 

PRODUCTS
SentimenTrader
Trading Tools
Indicators & Data API
‍
Strategies & Scanner
‍
Research Reports
FREE
RESOUrCES
Simple Backtest
Calculator
Simple Seasonality
Calculator
The Kelly Criterion
Calculator
Sentiment Geo Map
‍
Public Research Reports
‍
Education
Sentiment Indicators
‍
Technical Indicators
‍
Pricing
Bundle pricing
‍
FAQ
‍
Announcements
‍
COMPANY
‍
About
‍
In the News
‍
Testimonials
‍
Client Success Stories
CONTACT
‍
General Inquiries
‍
Media Inquiries
‍
Financial Professionals Inquiries
‍
© 2026 Sundial Capital Research Inc. All rights reserved.
Setsail Marketing
TermsPrivacyAffiliate Program
Risk Disclosure: The information and tools provided are for research and analytical purposes only and are not intended as investment advice. Market analysis involves uncertainty, and outcomes may differ from expectations. Users should conduct their own due diligence and consider their individual circumstances before making any financial decisions. Past performance is not necessarily indicative of future results.

Hypothetical Performance Disclosure: Hypothetical performance results have many inherent limitations, some of which are described below. No representation is being made that any account will or is likely to achieve profits or losses similar to those shown; in fact, there are frequently sharp differences between hypothetical performance results and the actual results subsequently achieved by any particular trading program. One of the limitations of hypothetical performance results is that they are generally prepared with the benefit of hindsight. In addition, hypothetical trading does not involve financial risk, and no hypothetical trading record can completely account for the impact of financial risk of actual trading. for example, the ability to withstand losses or to adhere to a particular trading program in spite of trading losses are material points which can also adversely affect actual trading results. There are numerous other factors related to the markets in general or to the implementation of any specific trading program which cannot be fully accounted for in the preparation of hypothetical performance results and all which can adversely affect trading results.

Testimonial Disclosure: Testimonials appearing on this website may not be representative of other clients or customers and is not a guarantee of future performance or success.