Products
SentimenTrader Trading Tools
‍
Backtest Engine
My Trading Toolkit
Correlation Analysis
Seasonality
Indicators & Data API
‍
Proprietary Indicators & Charts
Market Data API
Strategies & Scanner
‍
50+ Trading Strategies
Smart Stock Scanner
Research Reports
‍
Research Solutions
Reports Library
Free Resources
Simple Backtest Calculator
Simple Seasonality Calculator
The Kelly Criterion Calculator
Sentiment Geo Map
Public Research Reports
Education
Sentiment Indicators
Technical Indicators
Pricing
Company
About
In the News
Testimonials
Client Success Stories
Contact
Log inLoginSign up
< BACK TO ALL REPORTS

Boom goes bust

Jason Goepfert
2020-04-01
A simulated measure of the VIX has (at least temporarily) peaked. The Yardeni Boom Bust Barometer is going bust.

Peak volatility

When thinking about volatility, most people gravitate toward the VIX "fear gauge." It's a handy measure for sure, but only goes back to 1990, or 1986 if we use the old calculation.

In the past, we've looked at a simulated VIX indicator that uses several different models to recreate what the VIX might have done if it existed at the time. Over the past couple of decades, the model has a 90% correlation to the VIX itself, so it's done a good job. Any model will have a hard time with outliers like the Black Monday crash in 1987 and this was no exception.

This simulated VIX (SimVIX) just peaked above 80%, which was barely eclipsed by a few days in 1987 and 2008. The key term there might be "peaked." The SimVIX has gone from its highest level in years to a 5-day low as of Tuesday.

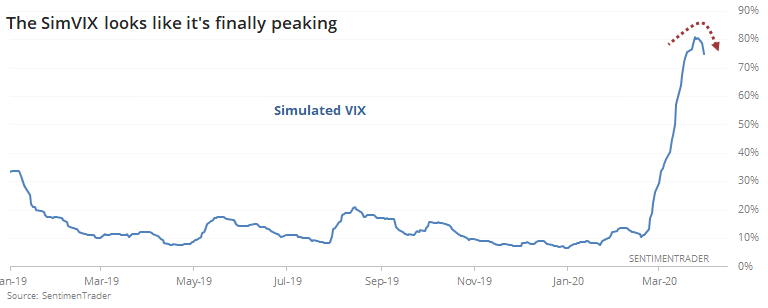
A 5-day low might seem insignificant, but when this indicator turns from an extreme, it has tended to keep going longer-term. For stocks, this typically meant a lot of shorter-term swings, usually to the downside, while hammering out important low points.


Boom goes bust

Economic data released in March wasn't all that terrible since most of it was for readings from February. But economic data released in April will be terrible, no doubt. 

Among some popular models that use fundamental inputs, the Yardeni Boom-Bust Barometer has already crashed to the lowest level in years. But why did it collapse? The Barometer is calculated by dividing the CRB Raw Industrial Price Index by Initial Claims. Initial Claims spiked to the highest level ever, causing this indicator to crash. That's why the "Boom-Bust" barometer collapsed. 

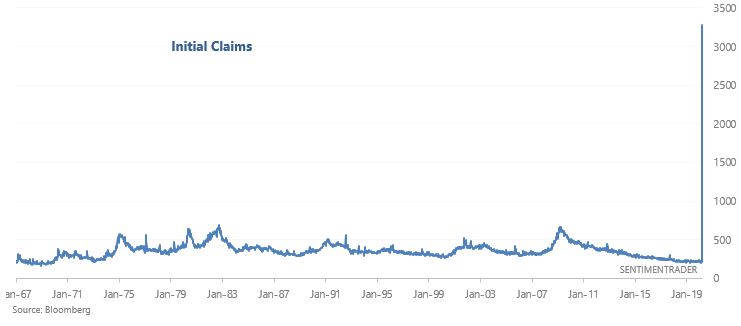
Other plunges in the Barometer tended to occur near the worst of economic readings, but not necessarily the worst of losses in stocks.

This is an abridged version of our recent reports and notes. For immediate access with no obligation, sign up for a 30-day free trial now.

We also looked at:

  • There are lots of shorts in UK stocks
  • What happens when volatility peaks
PRODUCTS
SentimenTrader
Trading Tools
Indicators & Data API
‍
Strategies & Scanner
‍
Research Reports
FREE
RESOUrCES
Simple Backtest
Calculator
Simple Seasonality
Calculator
The Kelly Criterion
Calculator
Sentiment Geo Map
‍
Public Research Reports
‍
Education
Sentiment Indicators
‍
Technical Indicators
‍
Pricing
Bundle pricing
‍
FAQ
‍
Announcements
‍
COMPANY
‍
About
‍
In the News
‍
Testimonials
‍
Client Success Stories
CONTACT
‍
General Inquiries
‍
Media Inquiries
‍
Financial Professionals Inquiries
‍
© 2026 Sundial Capital Research Inc. All rights reserved.
Setsail Marketing
TermsPrivacyAffiliate Program
Risk Disclosure: Futures and forex trading contains substantial risk and is not for every investor. An investor could potentially lose all or more than the initial investment. Risk capital is money that can be lost without jeopardizing ones’ financial security or life style. Only risk capital should be used for trading and only those with sufficient risk capital should consider trading. Past performance is not necessarily indicative of future results.

Hypothetical Performance Disclosure: Hypothetical performance results have many inherent limitations, some of which are described below. No representation is being made that any account will or is likely to achieve profits or losses similar to those shown; in fact, there are frequently sharp differences between hypothetical performance results and the actual results subsequently achieved by any particular trading program. One of the limitations of hypothetical performance results is that they are generally prepared with the benefit of hindsight. In addition, hypothetical trading does not involve financial risk, and no hypothetical trading record can completely account for the impact of financial risk of actual trading. for example, the ability to withstand losses or to adhere to a particular trading program in spite of trading losses are material points which can also adversely affect actual trading results. There are numerous other factors related to the markets in general or to the implementation of any specific trading program which cannot be fully accounted for in the preparation of hypothetical performance results and all which can adversely affect trading results.

Testimonial Disclosure: Testimonials appearing on this website may not be representative of other clients or customers and is not a guarantee of future performance or success.