
Bonds not out of the woods yet

Key points
- Following a disastrous decline, bonds rallied hard off of their October lows
- Long-term treasuries presently face a combination of significant resistance and an unfavorable seasonal window
- Options on TLT allow a trader to speculate on the short side of t-bonds with limited risk
Assessing the long-term trend in interest rates
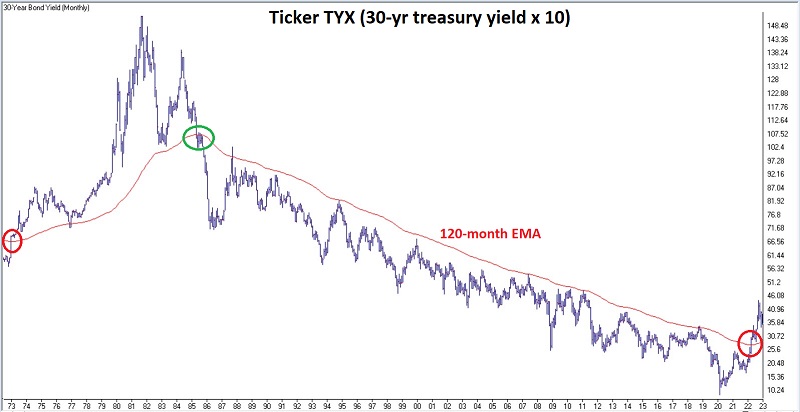
Interest rates tend to move in very long waves - often 30 years or more at a time. The 30-year t-bond yield peaked at 15.2% in 1981 and did not bottom out until March 2020 at 0.84%. Ticker TYX - which tracks 30-year bond yields (x10), has moved back above its 120-month exponential moving average. This suggests that we are now in a rising rate environment, and history suggests this environment could last for many years (though there is no guarantee). As interest rates rise, bond prices decline - and vice versa.
The chart below (and the two after that, courtesy of AIQ TradingExpert) displays a monthly graph of ticker TLT along with its 120-month exponential moving average. As long as TYX remains above its moving average, we are in a rising rate environment on a trend-following basis.
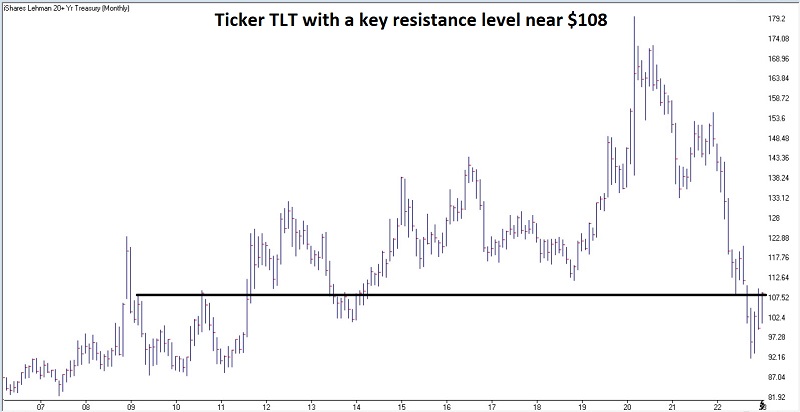
TLT is testing key resistance level
The monthly chart below shows that iShares 20+ Yr. Treasury ETF is testing a key resistance level.
In addition, following the recent rally, TLT is also testing its 200-day moving average.
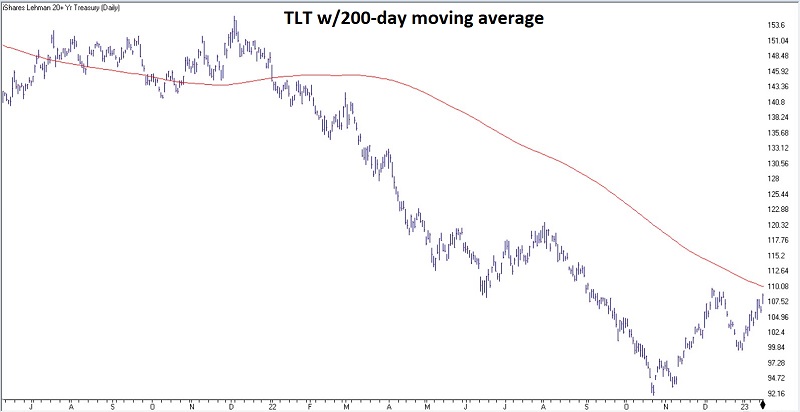
Unless and until these key price levels are pierced, it is fair to deem the trend in t-bond prices as negative.
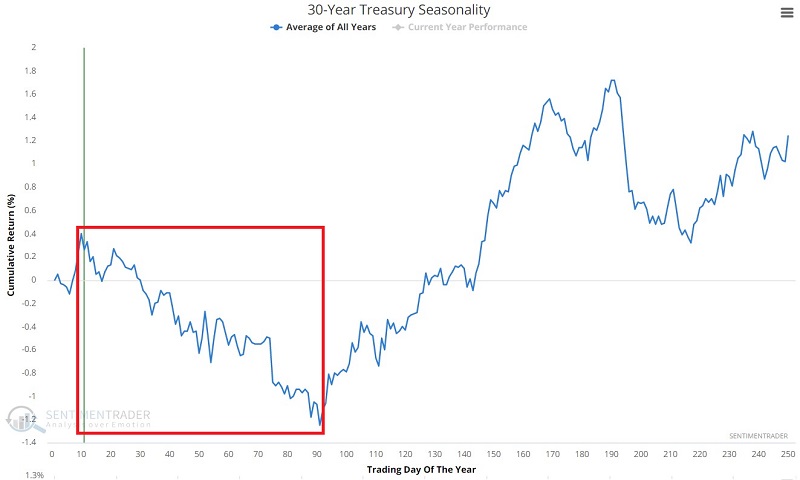
Seasonality is a headwind until May
The chart below shows the annual seasonal trend for ticker TLT. An unfavorable period extends from the close of Trading Day of Year (TDY) #10 through TDY #91. For 2023 this period extends from the close on 2023-01-17 through 2023-05-12.
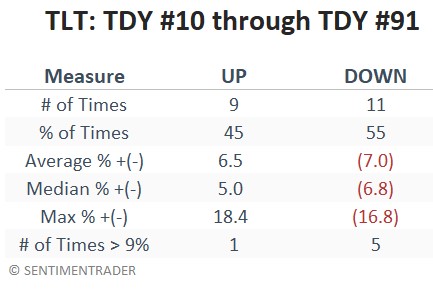
The chart below displays the growth of $1 invested in TLT from TDY #10 through TDY #91 each year since 2003. The table summarizes performance.
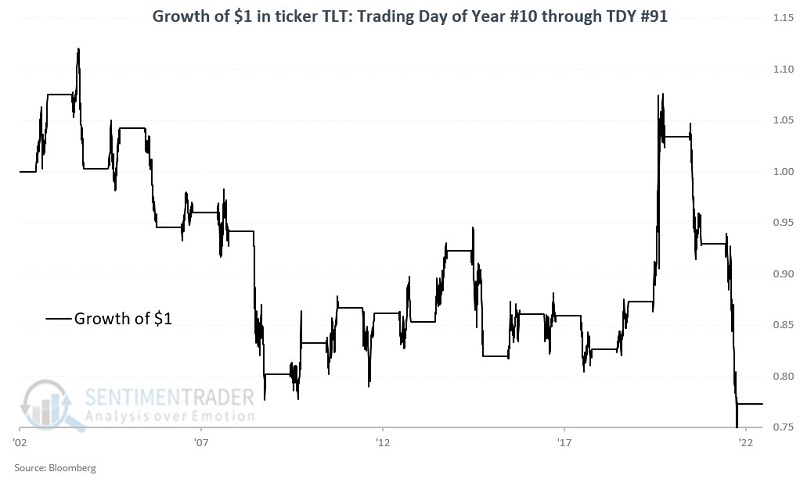
There is no reason that TLT cannot break through the resistance levels highlighted above and continue to rally higher. But the evidence above argues for favoring the short side of t-bonds.
An example options play in TLT
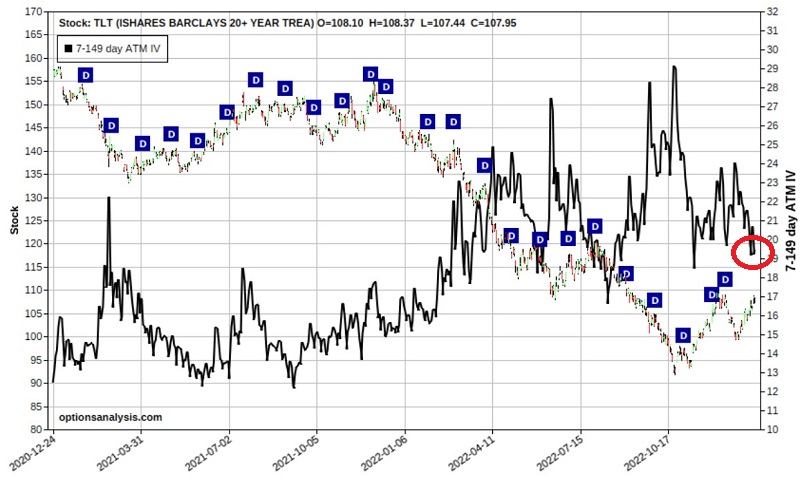
The most straightforward approach to speculating on a decline in the price of TLT using options is to buy a put option. However, in the chart below (courtesy of Optionsanalysis), we see that implied volatility (black line) for TLT options is on the higher end of the historical range. This tells us that an above-average amount of time premium is built into the price of TLT options. As a result, if we contemplate a trade using TLT options, we should recognize the potential for a subsequent decline in implied volatility to impact our trade.
For this reason, for our example trade, we will consider buying a well-in-the-money put option by purchasing a put option with a delta of roughly -70. Delta is a Greek option value that indicates the approximate stock equivalent position. In other words, a put option with a delta of -70 can be expected to behave similarly to a position holding short 70 shares of TLT (but without the unlimited risk).
Our example trade is as follows:
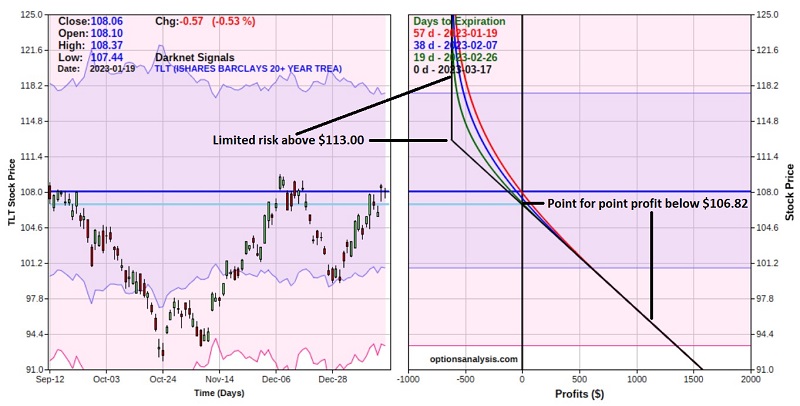
- Buy 1 TLT Mar17 2023 113 put @ $6.18
The particulars and risk curves appear in the screenshots below.
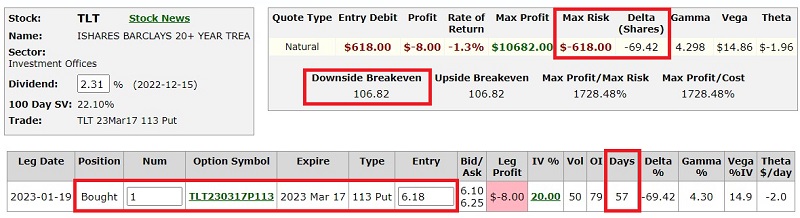
Things to note:
- The cost to enter a 1-lot - and the maximum risk on the trade - is $618
- The option price is comprised of $4.94 of intrinsic value (113 strike price - 108.06 TLT price) and only $1.24 of time premium (we limited the amount of time premium paid by buying an in-the-money strike price)
- The breakeven price basis TLT shares (if the option trade is held until expiration) is $106.82 (i.e., TLT must decline at least -1.15% for this trade to show a profit at expiration)
- This trade is a speculative bet on a decline in the price of TLT shares. If TLT declines in price, this position will gain $100 in value for each full point TLT shares drop below the breakeven price of $106.82.
- If TLT were to fall back to its October low of $91.85, the option position would be expected to show an approximate open profit of roughly $1,500
Managing the trade
A trader holding the TLT Mar17 113 put should form contingency plans depending on whether TLT rises or falls in price. On the upside, a trader might abandon the trade altogether if TLT rises much above the recent highs near $110.
On the downside, a trader might monitor a favored overbought/oversold indicator and consider taking a profit or adjusting the trade if the indicator signals an oversold situation. Another potential profit-taking area might be near the December low, around $99.40 if TLT happened to fall that far.
What the research tells us…
A confluence of price and seasonal indicators suggests that t-bonds could reverse lower in the near term. Buying a put option on ticker TLT is one way to speculate on this possibility. Buying a put option allows a trader to profit if TLT falls in price while limiting risk to the premium paid to buy the put.
There is no guarantee, however, that TLT will move lower. The shares could easily rally much higher if recent resistance is taken out. As a result, a trader needs to plan how they will handle this situation (i.e., by cutting a loss, adjusting the position, or simply letting it ride). A plan for profit-taking is also well-advised.