Data &
Technology
Research
Reports
Report Solutions
Reports Library
Actionable
Strategies
Free
Resources
Simple Backtest Calculator
Simple Seasonality Calculator
The Kelly Criterion Calculator
Sentiment Geo Map
Public Research Reports
Free Webinar
Pricing
Company
About
Meet Our Team
In the News
Testimonials
Client Success Stories
Contact
Log inLoginSign up
< BACK TO ALL REPORTS

Bonds have made an extreme move

Jason Goepfert
2021-02-12
The 1-year z-score for 10-year Treasury yields and the yield curve has reached an extremely high level.

The march higher in the yield on 10-year Treasury notes took a breather on Tuesday, but it's mostly been a steady rise for most of the last 6 months. So much so that the 1-year z-score, a measure of how unusual the move is relative to recent history, just reached 1.5 standard deviations for the 4th distinct time in the past decade.

The push higher in rates has been focused mostly on the longer end of the Treasury yield curve, so the 2-year / 10-year spread has also made an extreme move. 

2 year 10 year treasury yield curve

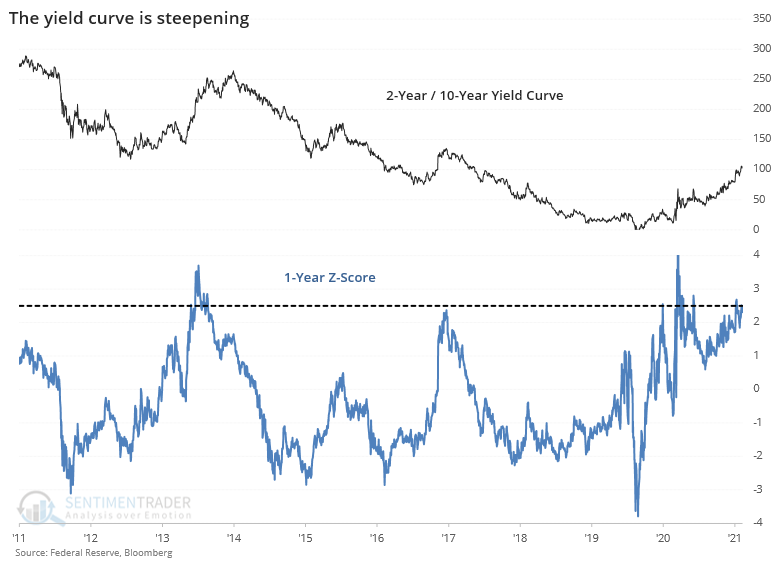
This is typically taken as a sign of economic growth and should be a positive for stocks going forward. When both the yield on 10-year notes and the yield curve were more than 1.5 deviations above trend, that mostly proved true. Over the next couple of months, there were only a couple of small losses.

What else we're looking at

  • Full returns since 1977 when rates and the yield curve move more than 1.5 standard deviations from average
  • What those signals have meant for other assets, factors, and major sectors
  • Across the most liquid ETFs, there has been a jump in gap up opens
  • An interesting wrinkle with the 20-year cycle in stocks

Stat Box

The most liquid ETF in the world, SPY, has gapped up at least 0.2% during 14 out of the last 20 sessions. That's one day shy of a record, and has been matched by only 6 other distinct times in its nearly 30 years of history.


Sentiment from other perspectives

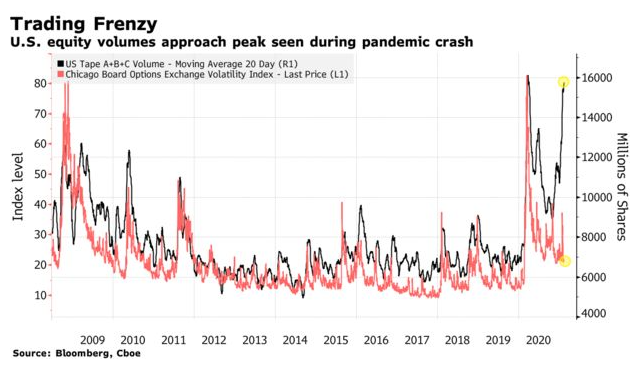
Trading is up, volatility is down. The dip in "fear" has created a scenario where trading activity has reached a frenzied pitch. This is extremely unusual, and is completely opposite to what usually happens, with volume rising along with implied volatility. Source: Bloomberg

volume versus volatility

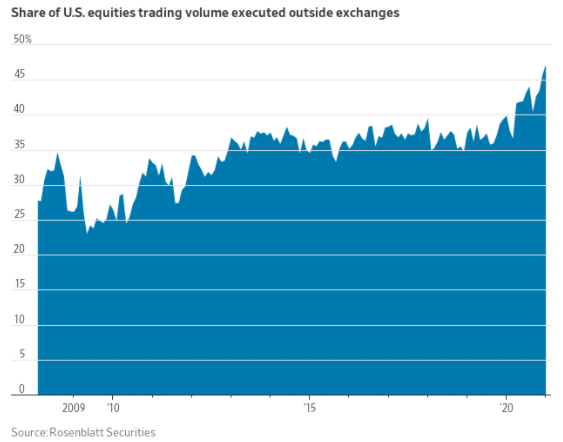
It's even more extreme. We can only see part of the volume being transacted in stocks. At this point, almost half of all volume is executed off the major exchanges, where there is no transparency whatsoever. This is a record high. Source: Wall Street Journal

dark exchange volume

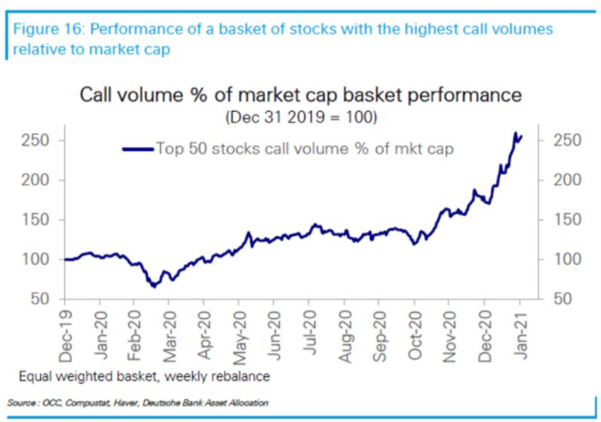
Thank you, options market. A lot of this surge in volume can be explained by trading in the options market. To a degree never before seen, that tail is wagging the dog. Source: Bloomberg

call option volume stock performance

DATA &
TECHnologies
IndicatorEdge
‍
BackTestEdge
‍
Other Tools
‍
DataEdge API
RESEARCH
reports
Research Solution
‍
Reports Library
‍
actionable
Strategies
Trading Strategies
‍
Smart Stock Scanner
‍
FREE
RESOUrCES
Simple Backtest
Calculator
Simple Seasonality
Calculator
The Kelly Criterion
Calculator
Sentiment Geo Map
‍
Public Research Reports
‍
Free Webinar
COMPANY
‍
About
‍
Meet our Team
‍
In the News
‍
Testimonials
‍
Client Success Stories
Pricing
Bundle pricing
‍
Announcements
‍
FAQ
© 2024 Sundial Capital Research Inc. All rights reserved.
Setsail Marketing
TermsPrivacyAffiliate Program
Risk Disclosure: Futures and forex trading contains substantial risk and is not for every investor. An investor could potentially lose all or more than the initial investment. Risk capital is money that can be lost without jeopardizing ones’ financial security or life style. Only risk capital should be used for trading and only those with sufficient risk capital should consider trading. Past performance is not necessarily indicative of future results.

Hypothetical Performance Disclosure: Hypothetical performance results have many inherent limitations, some of which are described below. No representation is being made that any account will or is likely to achieve profits or losses similar to those shown; in fact, there are frequently sharp differences between hypothetical performance results and the actual results subsequently achieved by any particular trading program. One of the limitations of hypothetical performance results is that they are generally prepared with the benefit of hindsight. In addition, hypothetical trading does not involve financial risk, and no hypothetical trading record can completely account for the impact of financial risk of actual trading. for example, the ability to withstand losses or to adhere to a particular trading program in spite of trading losses are material points which can also adversely affect actual trading results. There are numerous other factors related to the markets in general or to the implementation of any specific trading program which cannot be fully accounted for in the preparation of hypothetical performance results and all which can adversely affect trading results.

Testimonial Disclosure: Testimonials appearing on this website may not be representative of other clients or customers and is not a guarantee of future performance or success.