Data &
Technology
Research
Reports
Report Solutions
Reports Library
Actionable
Strategies
Free
Resources
Simple Backtest Calculator
Simple Seasonality Calculator
The Kelly Criterion Calculator
Sentiment Geo Map
Public Research Reports
Free Webinar
Pricing
Company
About
Meet Our Team
In the News
Testimonials
Client Success Stories
Contact
Log inLoginSign up
< BACK TO ALL REPORTS

Bond sentiment is coming back from the brink

Jason Goepfert
2021-12-16
Sentiment on bonds is improving after deep pessimism a few weeks ago. Using the performance of small-cap stocks as an indicator for interest rates.

Bond sentiment reverses from extreme pessimism

Investors ditched bonds a few weeks ago, and now they're gingerly coming back.

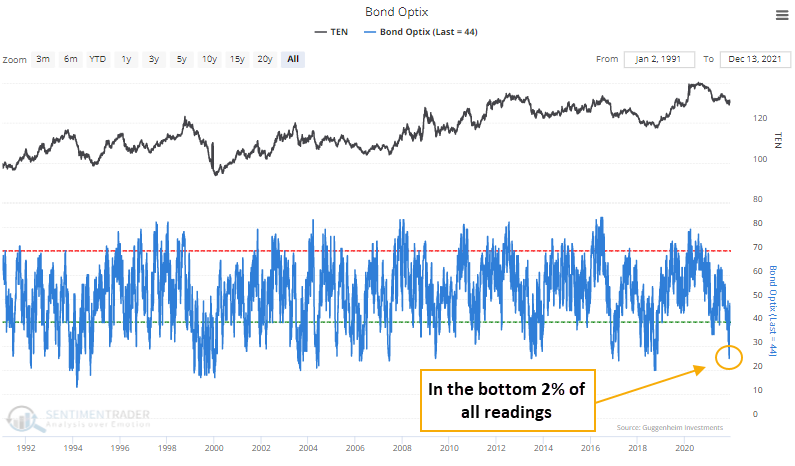
The Optimism Index (Optix) for bonds plunged to 25% in late November. Since then, it has rebounded and not set another low, raising the possibility that sentiment has troughed.

That heavy pessimism from before Thanksgiving was in the bottom 2% of all days in the past 30 years.

Treasury bond sentiment neared a record low

Let's make the assumption that not setting a lower low in sentiment for 15 consecutive days, after recording a reading below 30%, suggests that investors have finished panicking. Then we can see if that improved forward returns. For 10-year Treasury futures, it did, but only modestly. Other bond products fared better, and other indicators support that view.

Stat box

Wednesday marked only the 12th time in history that stocks and bonds had such a pronounced reaction to a FOMC meeting, with SPY rising more than +0.75% and TLT declining more than 0.75%.


Using small-caps as a canary for interest rates

Small-cap stocks can be more sensitive to economic conditions. So, it makes some sense that when those stocks are outperforming, bond yields tend to rise.

Jay looked at a small-cap index and a large-cap index starting in 1926, using a simple trend-following method on the ratio between the two to determine its impact on interest rates.

To measure the efficiency of this simple method for tracking interest rates, let's use the following methodology:

  • Add changes in yield points if the small-cap/large-cap trend is up
  • Subtract changes in yield points if the small-cap/large-cap trend is down

The chart below displays the cumulative yield points captured using this method since 1926.

Using the small cap large cap ratio to determine interest rates

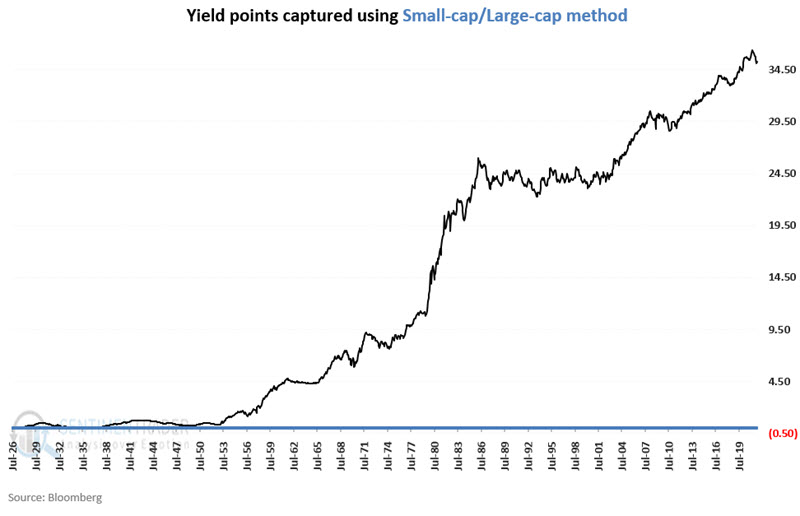
The ebb and flow between small-cap and large-cap stocks have demonstrated a high degree of correlation with the fluctuations of interest rates over the past 95 years. Tracking this relationship as described above can help an investor stay in tune with the primary interest rate trend and filter out a lot of the "noise" generated on the topic.

DATA &
TECHnologies
IndicatorEdge
‍
BackTestEdge
‍
Other Tools
‍
DataEdge API
RESEARCH
reports
Research Solution
‍
Reports Library
‍
actionable
Strategies
Trading Strategies
‍
Smart Stock Scanner
‍
FREE
RESOUrCES
Simple Backtest
Calculator
Simple Seasonality
Calculator
The Kelly Criterion
Calculator
Sentiment Geo Map
‍
Public Research Reports
‍
Free Webinar
COMPANY
‍
About
‍
Meet our Team
‍
In the News
‍
Testimonials
‍
Client Success Stories
Pricing
Bundle pricing
‍
Announcements
‍
FAQ
© 2024 Sundial Capital Research Inc. All rights reserved.
Setsail Marketing
TermsPrivacyAffiliate Program
Risk Disclosure: Futures and forex trading contains substantial risk and is not for every investor. An investor could potentially lose all or more than the initial investment. Risk capital is money that can be lost without jeopardizing ones’ financial security or life style. Only risk capital should be used for trading and only those with sufficient risk capital should consider trading. Past performance is not necessarily indicative of future results.

Hypothetical Performance Disclosure: Hypothetical performance results have many inherent limitations, some of which are described below. No representation is being made that any account will or is likely to achieve profits or losses similar to those shown; in fact, there are frequently sharp differences between hypothetical performance results and the actual results subsequently achieved by any particular trading program. One of the limitations of hypothetical performance results is that they are generally prepared with the benefit of hindsight. In addition, hypothetical trading does not involve financial risk, and no hypothetical trading record can completely account for the impact of financial risk of actual trading. for example, the ability to withstand losses or to adhere to a particular trading program in spite of trading losses are material points which can also adversely affect actual trading results. There are numerous other factors related to the markets in general or to the implementation of any specific trading program which cannot be fully accounted for in the preparation of hypothetical performance results and all which can adversely affect trading results.

Testimonial Disclosure: Testimonials appearing on this website may not be representative of other clients or customers and is not a guarantee of future performance or success.