Bollinger Band Buy Signal Concept

The crash in Chinese internet stocks has been a topic of conversation on social media applications as several stocks and ETFs have fallen by 50% or more from their respective highs. I've been on record in previous notes that I never want to catch a falling knife. I would rather wait for a trading signal to develop so I can measure the risk/reward profile for a potential new idea. The following quote from Reminiscences of a Stock Operator is one of the more appropriate trading lessons to grasp when thinking about buying an oversold condition.
"One of the most helpful things that anybody can learn is to give up trying to catch the last eighth or the first. These two are the most expensive eighths in the world. They have cost stock traders, in the aggregate, enough millions of dollars to build a concrete highway across the continent."
With Chinese stocks under pressure, I thought it would be a good time to share one of the components in the TCTM Composite Washout Model.
Let's review how I use Bollinger Bands, a classic volatility indicator created by John Bollinger to identify a low volatility capitulation reversal.
TECHNICAL INDICATOR
I use the standard Bollinger Band settings found in most charting applications.
Input length = 20 bars/days.
Standard deviation bands = +2 and -2.
Bollinger Band Spread = ((UpperBand/LowerBand)-1)*100;
THE CONCEPT
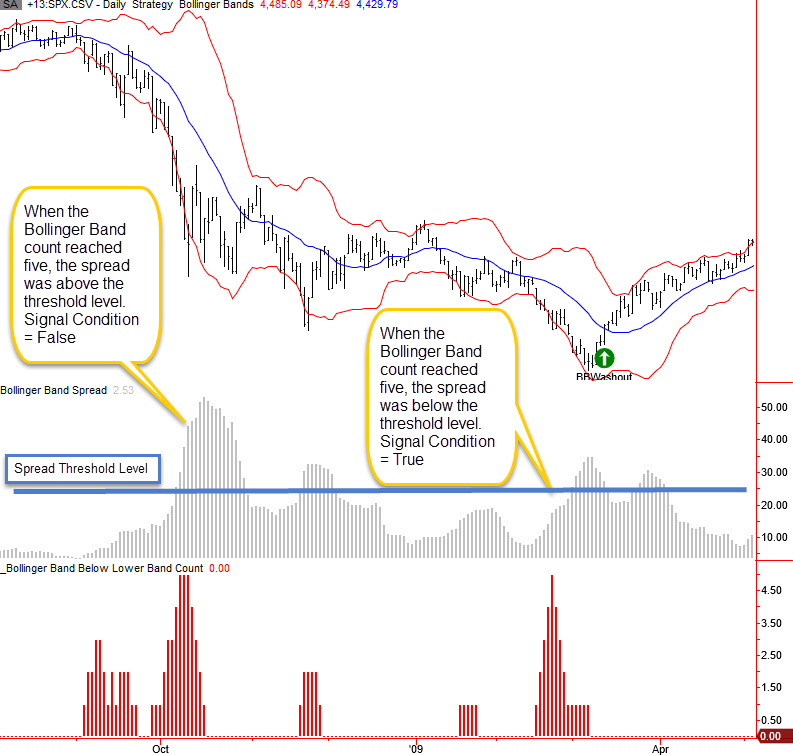
The Bollinger Band signal identifies when the price of a stock, index, or ETF closes below the lower Bollinger Band for five consecutive days and reverses higher to close above the midline. And, signals can only occur when the spread between the upper and lower Bollinger band is below a user-defined volatility level.
SIGNAL CRITERIA FOR THE S&P 500 INDEX
1.) If the underlying security price closes below the lower Bollinger Band for five consecutive days, the oversold/capitulation condition is active.
2.) When the lower Bollinger Band count = 5, the spread between the upper and lower Bollinger Band must be less than 25%.
3.) If condition1 and condition2 and the price of the underlying security close' above the Bollinger Band midline, go long.
The spread condition is the most crucial setting in the trading signal. I never what to catch a falling knife. The goal is to identify a lower volatility capitulation.
CHART EXAMPLE
The 2007-08 financial crisis provides a good example of how the model will avoid a signal if the spread is above the user-defined threshold when the Bollinger band count reaches five days.
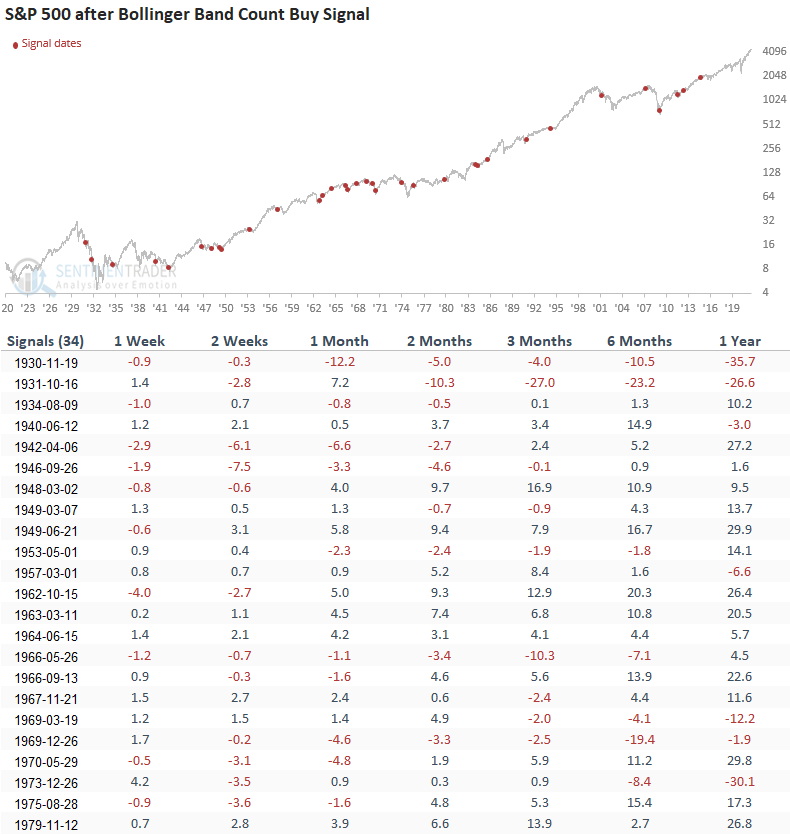
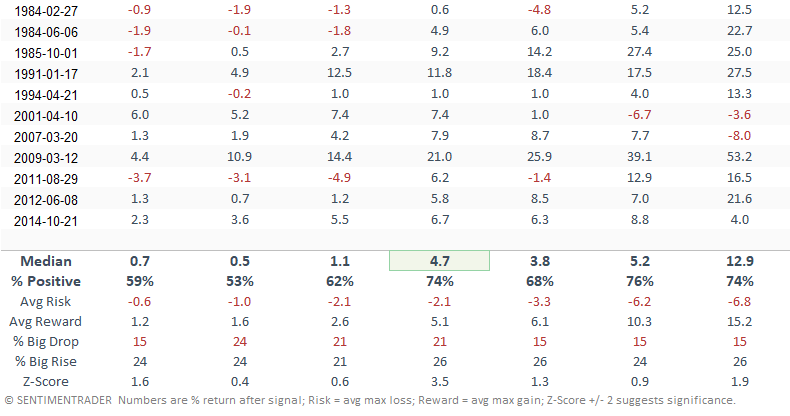
HOW THE SIGNALS PERFORMED
Results look inline in the short term, which is not surprising as mean reversion signals can be choppy. The 2-month timeframe looks good with an excellent risk/reward profile.
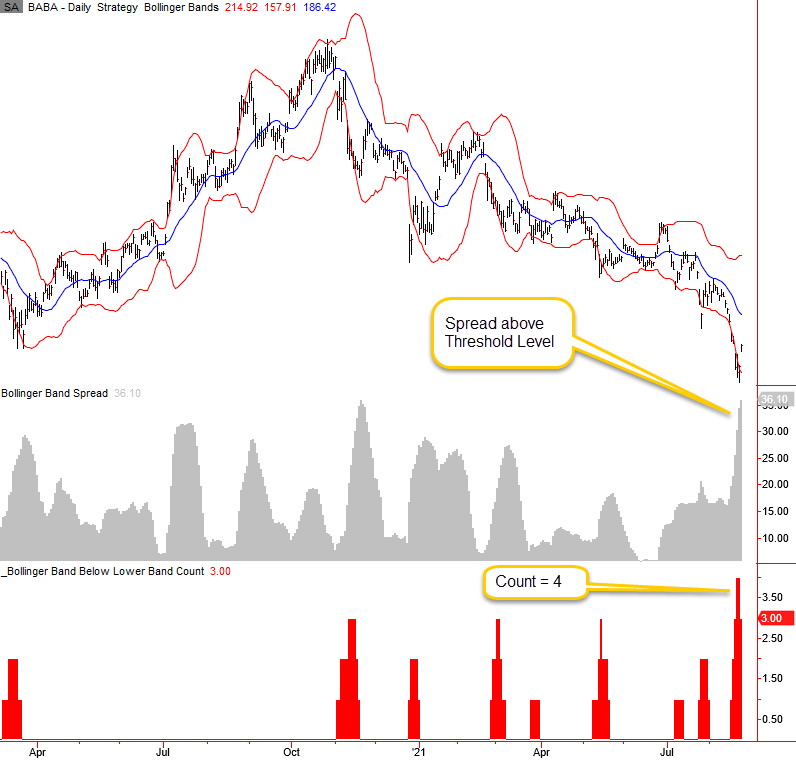
CHINESE INTERNET EXAMPLE - ALIBABA GROUP ADR (BABA)
Alibaba (BABA) provides a great example of why it's essential to have a trading plan and the discipline to carry it out. How often have we heard that BABA is a great buying opportunity in the last nine months? If the roulette wheel hits black seven consecutive times, does that mean we should bet on red on the next spin?
The use of trading signals can be beneficial if one has the discipline to stick with a plan. If a signal doesn't materialize, you have to stay away, even if that means you don't buy BABA near the lows.