
Bitcoin and the Purchasing Managers Index

Key points
- There appears to be a correlation between Bitcoin price movements and the trend of the PMI Index
- A simple application of rudimentary trading rules may help traders identify favorable times to hold Bitcoin
- While hypothetical results have underperformed buy-and-hold, they also sidestepped many of Bitcoin's massive drawdowns
About the PMI Index
The PMI Index attempts to measure economic trends. According to www.Investopedia.com:
What Is the Purchasing Managers' Index (PMI)?
The Purchasing Managers' Index (PMI) measures the prevailing direction of economic trends in the manufacturing and service sectors. It is compiled and released monthly by the Institute for Supply Management (ISM), a nonprofit supply management organization.
It is a diffusion index that summarizes whether market conditions are expanding, staying the same, or contracting, as viewed by purchasing managers. The purpose of the PMI is to provide information about current and future business conditions to company decision-makers, analysts, and investors.
During the relatively short history of Bitcoin trading, there appears to be a potentially helpful relationship between the PMI trend and Bitcoin.
Testing the relationship
This piece highlights the relationship between monthly PMI readings and Bitcoin price movements. While we will test results in the format of a trading system, no claim is being made that investors could or should use it in the manner presented.
First, a few technical notes:
We use the latest available index value for the PMI Index at the end of each calendar month. For Bitcoin, we use the reported closing price at the closing of trading on the month's last trading day. Note that there is no guarantee that a trader could have bought or sold Bitcoin at exactly that price. Thus, a caveat exists that all results are entirely hypothetical.
Creating a rudimentary model
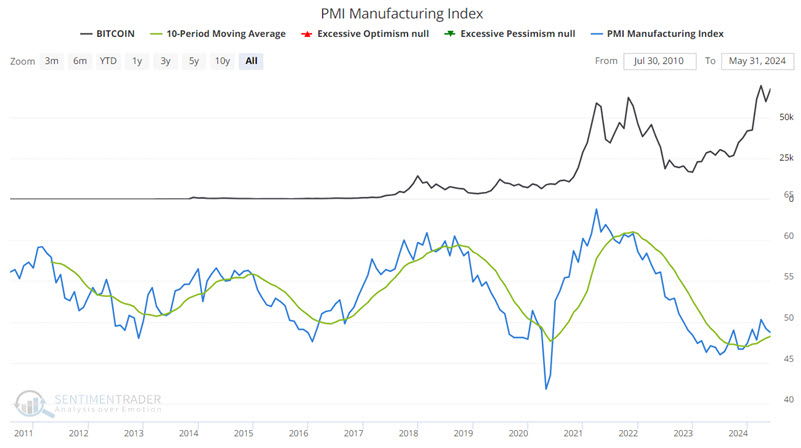
To keep it simple, we will look at the latest PMI value available at the end of the month and compare that value to the 10-month moving average of month-end PMI readings.
The chart below displays the price for Bitcoin at the top, the PMI Index value (blue line), and its 10-month moving average (green line) in the bottom clip.
We will apply the following rules:
- If PMI closes a month above its 10-month moving average, we will assume a long position is entered in Bitcoin at its monthly closing price
- If PMI closes a month below its 10-month moving average, we will assume that a flat position is entered in Bitcoin at its monthly closing price
That's it.
Hypothetical results underperform buy-and-hold but significantly reduce volatility
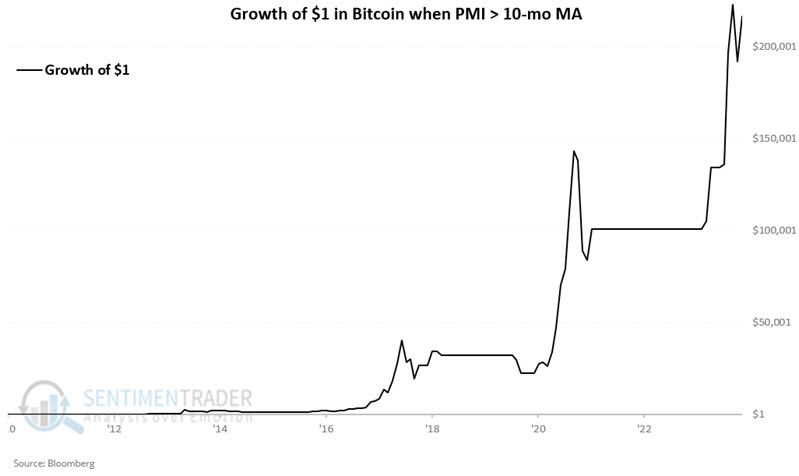
The chart below displays the hypothetical growth of $1 invested in Bitcoin only if the PMI closed the previous month above its 10-month moving average. Note that this simple rule captured several of Bitcoin's most significant price surges.
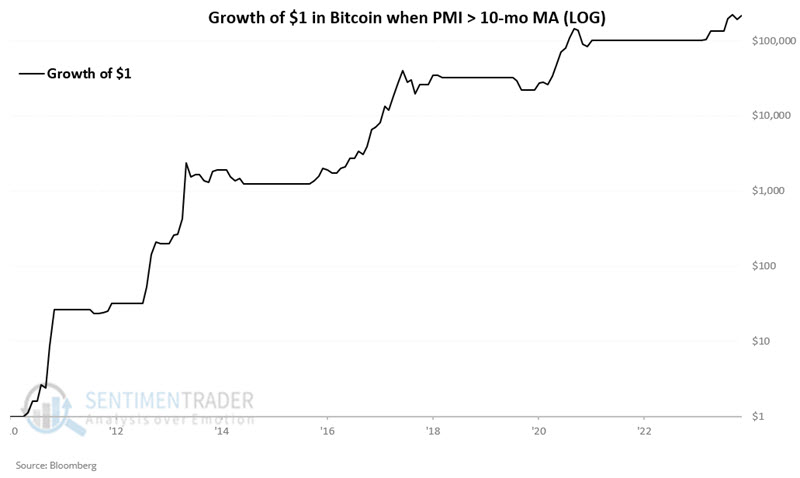
The chart below displays the same information as the chart above on a logarithmic scale.
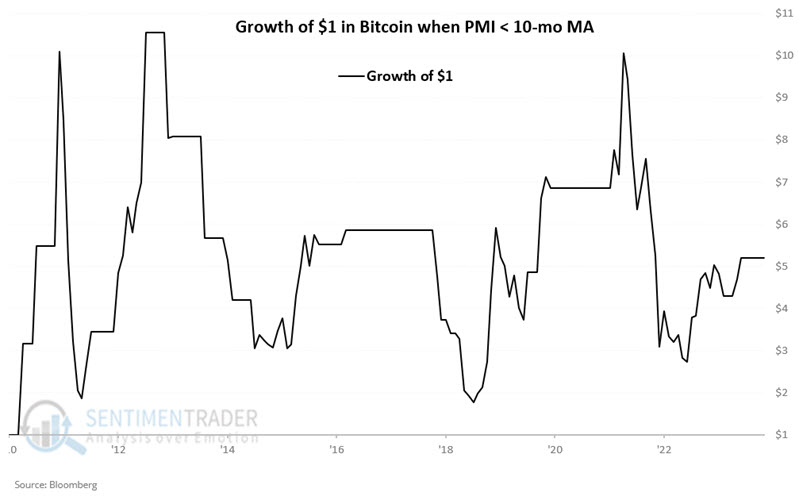
Conversely, the chart below displays the hypothetical growth of $1 invested in Bitcoin only if the PMI closed the previous month below its 10-month moving average. While holding during these periods technically shows a significant gain (over 500% from start to finish), the results are extremely (to put it mildly) volatile - potentially to the point that many individuals might have trouble riding out the declines.
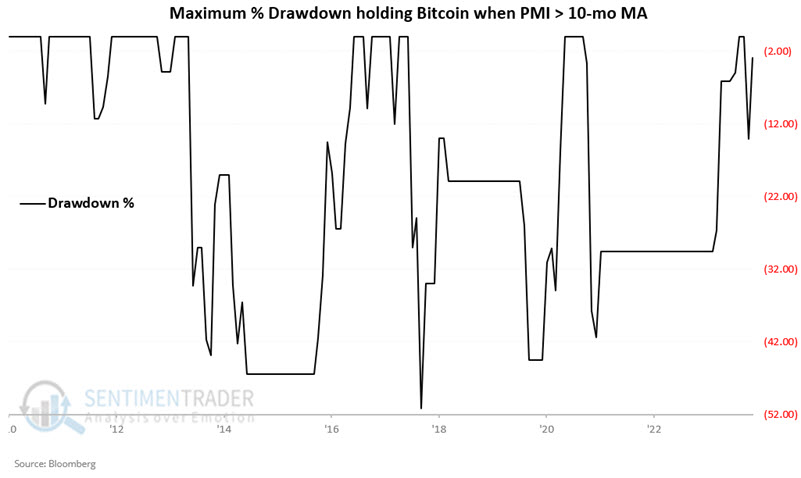
There is no denying that Bitcoin price movements have been (and will likely remain) highly volatile. The chart below displays the percentage drawdowns experienced by holding Bitcoin only when the PMI exceeded its 10-month moving average. Note that four drawdowns have been over -40% and one of -51%.
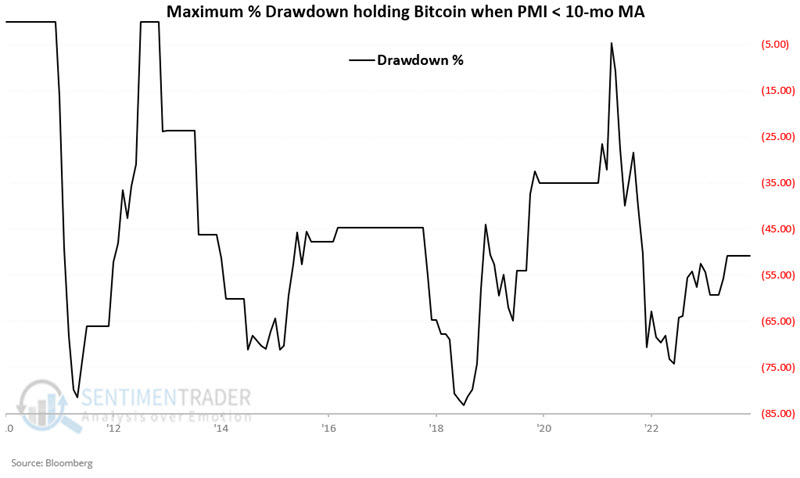
The chart below displays the percentage drawdowns experienced by holding Bitcoin only when the PMI was below its 10-month moving average. Note that four drawdowns were over -70%, and two were over -80%. Using PMI as a filter might have allowed a trader to avoid these extreme (and psychologically difficult to ride through) drawdowns.
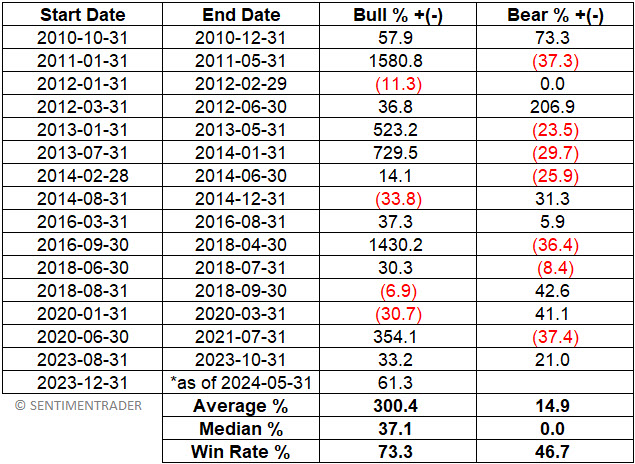
The table below displays the hypothetical "trades" based on buying or selling Bitcoin at the month-end price based on month-end PMI readings versus its 10-month moving average.
What the research tells us…
The first thing to emphasize is that all results displayed above are purely hypothetical, and no inference is being made that a trader would have achieved precisely the above results. Likewise, it is worth reiterating that the suggestion is not to use the rules above as a mechanical trading system but to factor in the PMI trend as weight of the evidence when considering a Bitcoin position.
The most crucial point is to note that the trend of PMI may be helpful as a weight of the evidence indicator regarding Bitcoin. The bad news is that the "system" (such as it is) detailed above technically underperformed a simple buy-and-hold approach holding Bitcoin. However, the price performance for Bitcoin was much more consistently favorable during so-called "favorable" periods (i.e., when PMI was above its 10-month average) than during so-called "unfavorable" periods. This may be worth factoring into any future buying or selling decisions regarding Bitcoin.