
Biotech stocks show a historic level of internal selling pressure

Key points:
- A custom index of Biotechnology stocks shows severe internal selling pressure
- Several metrics are showing readings on par with the worst declines in 22 years
- Initial recoveries following severely oversold readings led to mostly higher long-term returns
Bio-techs have been bio-wrecks
Heading into February's speculative peak, almost everything was in gear. That euphoric sentiment eased as some of the riskiest parts of the markets took a dive or treaded water at best.
Since then, there have been entire sectors that have lagged the broader market. Some equity indexes, especially those weighted by market capitalization, are at or near record highs. But not everyone is enjoying the gains.
As the Wall Street Journal recently noted:
"Biotech stocks have fallen to earth with a thud in 2021 after soaring last year amid excitement over the development of Covid-19 vaccines, dealing big losses to some hedge funds...
The SPDR S&P Biotech ETF (XBI), an equal-weighted index of biotech stocks, has fallen about 22% so far this year through Friday, and is down 37% from its Feb. 8 peak. The ETF has tumbled nearly 9% since Thanksgiving. Biotech has performed worse than all 11 S&P 500 sectors this year, a time when the broader index has notched a total gain of nearly 21%."
Getting reliable information on the losses in the sector is difficult. It's a notoriously volatile group, with share prices skyrocketing based on rumors or collapsing and de-listing based on the same. That can trigger heavy turnover in Biotechnology indexes, with historical studies often suffering from survivorship bias.
Looking at Biotech destruction under the surface
Using Portfolio123, we can create metrics that look at the breadth of the performance among many of these stocks to gauge whether recent declines are enough to suggest the worst is likely over. We've done our best to recreate the stocks included in the ICE Biotechnology Index, the index underlying the largest Biotech fund, IBB. There are a little over 300 stocks in the custom index, but it is not perfect.
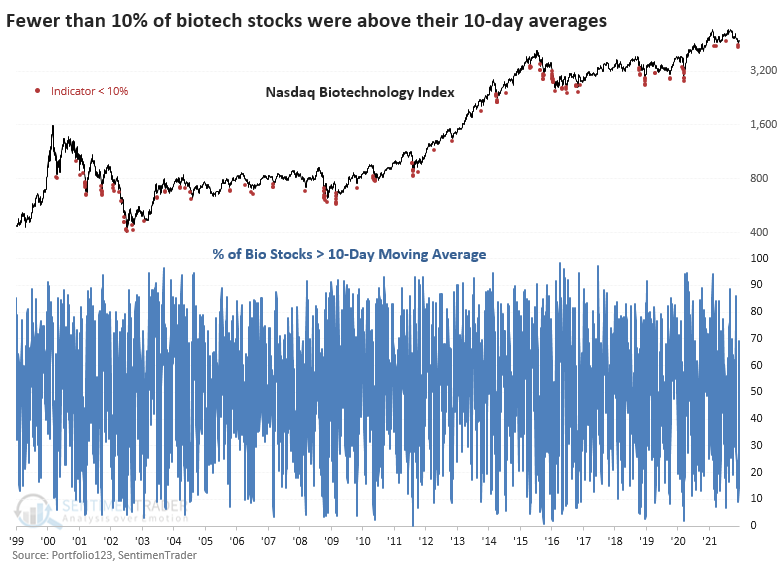
There is some evidence that the selling pressure is overdone. At the recent low, fewer than 10% of these stocks traded above their 10-day moving averages. That ranks in the bottom 2% of all days since 1999.
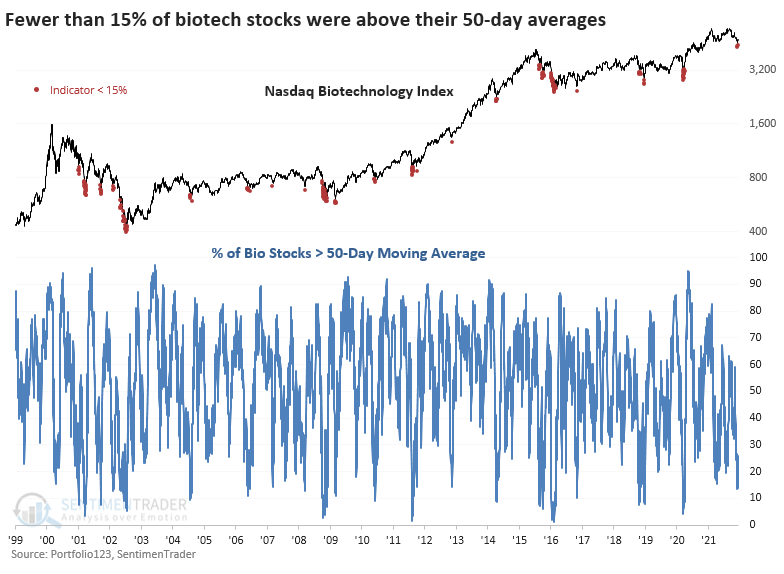
Fewer than 15% of them traded above their 50-day averages, ranking in the bottom 3% of all days.
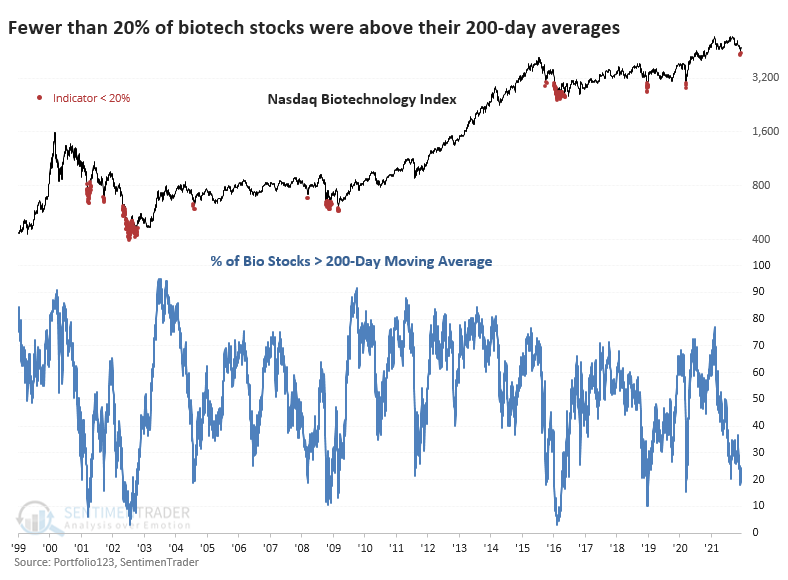
Fewer than 20% of them held above their long-term 200-day moving averages, in the bottom 4% of all days.
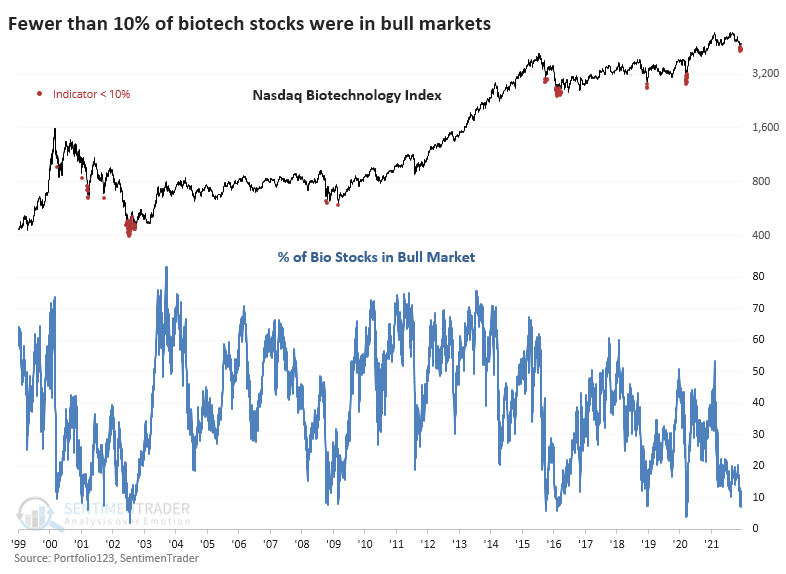
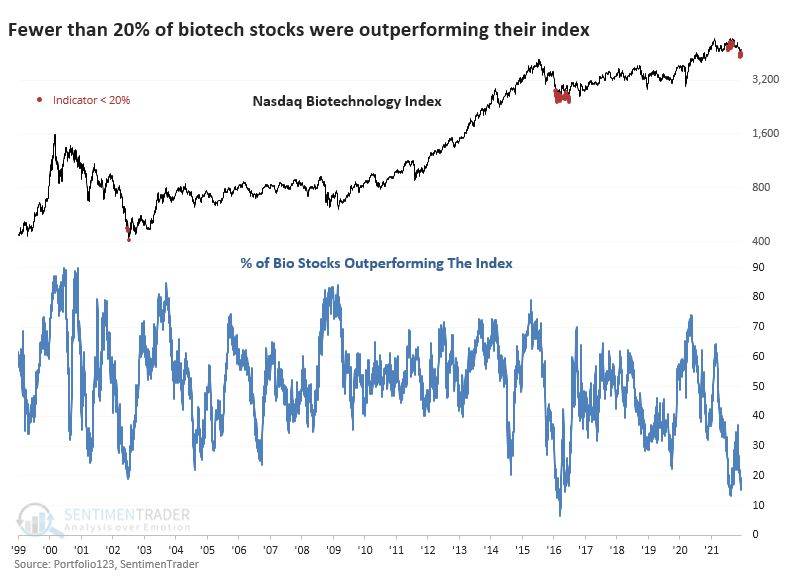
Fewer than 10% of Biotech stocks were able to hold within 20% of their 52-week highs, ranking in the bottom 1% of all days in the past 22 years.
Fewer than 20% of the stocks outperformed a broad Biotech index, ranking in the bottom 1% of all days.
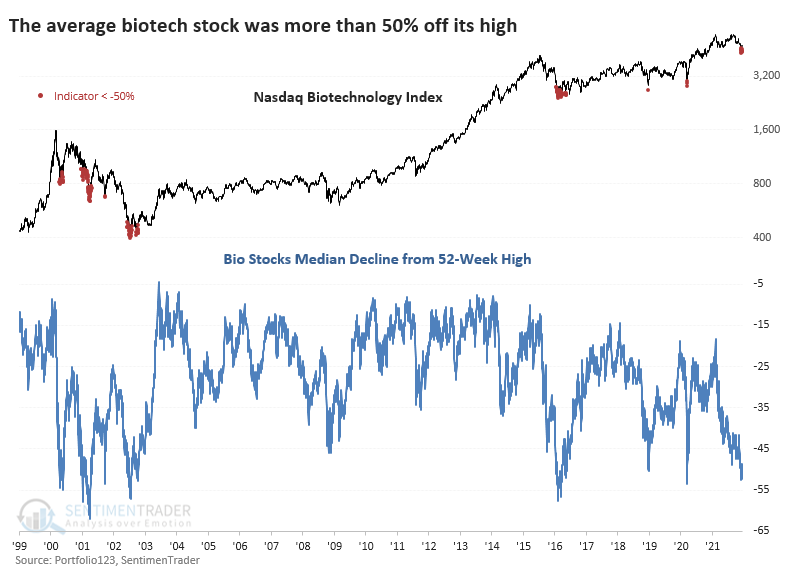
The median stock in this sector got hammered, with a drawdown of more than 50% from its 52-week high. That's in the bottom 2% of all readings.
Combining all these metrics into a composite, it recently dipped below 20%, recording a level of oversold behavior in the bottom 1% of all days.
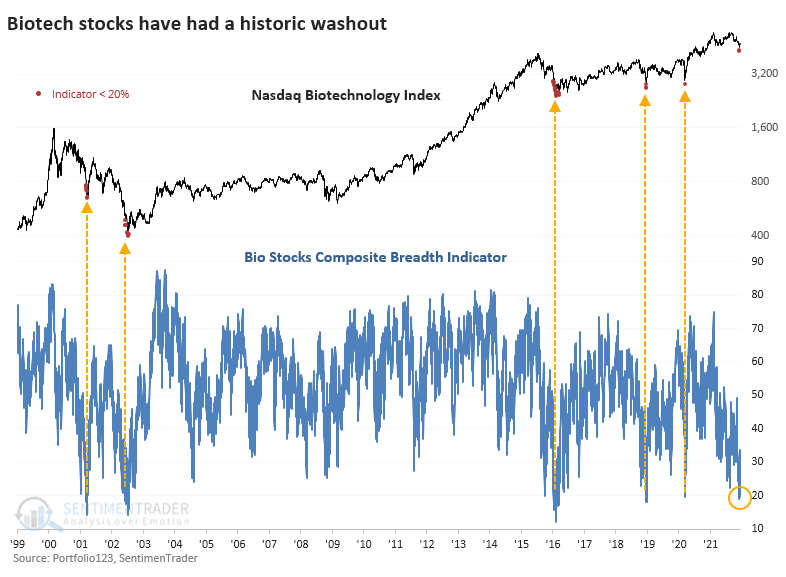
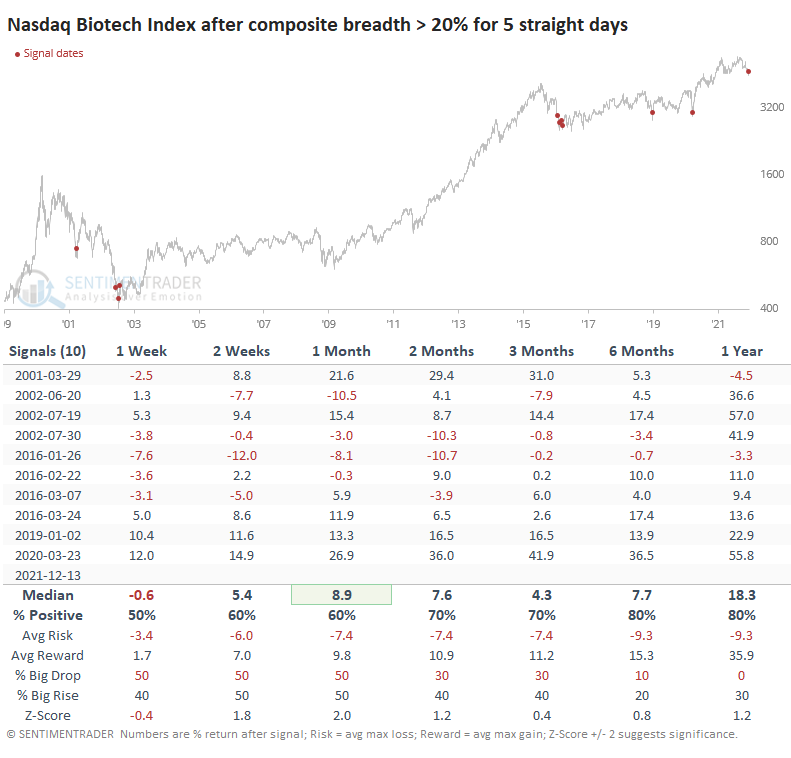
The stocks have recovered a bit since then. The composite has risen above 20% and held there for more than a week, suggesting the worst of the selling pressure could be behind.
Other times the composite did this, it was usually the case that the sector was washed out. The most significant risk is a cluster of these signals in 2002 and 2016 as they whipped back and forth. Long-term returns were still decent, but early buyers got some heartburn.
What the research tells us...
Biotech stocks are a tough group for traders and even tougher for investors. They can go years with little reward, punctuated by the occasional panic due to a regulatory move or alarming study outcome. Despite a year of miraculous advances, many of these stocks have not only been overlooked but sold aggressively.
The selling pressure heading into this week was on par with some of the worst internal declines in 22 years. While it's always a risk to rely only on historical precedents, especially in the shorter term (witness Chinese tech stocks), there is some decent evidence that long-term returns in the sector should be positive.