
Biotech on the Cheap

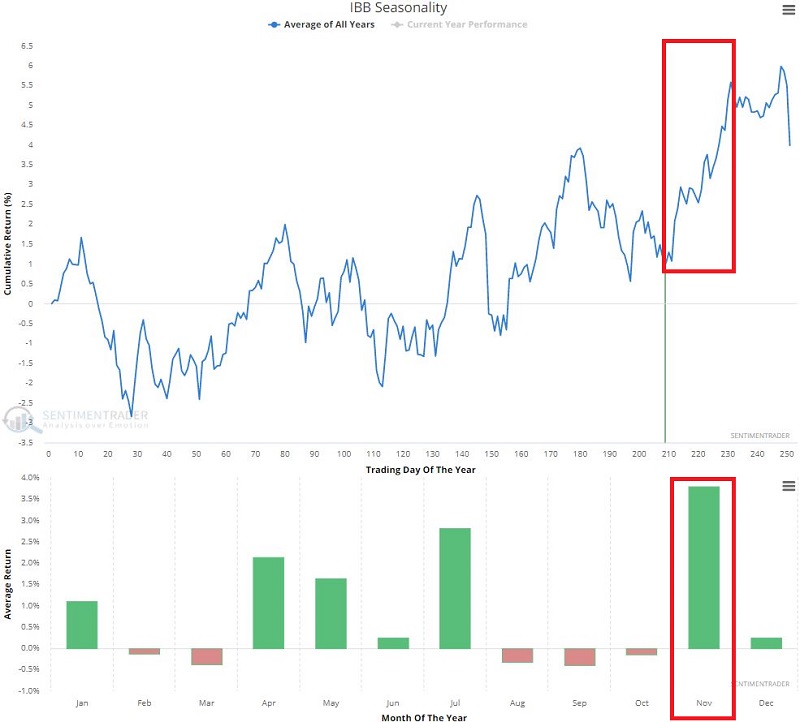
As Jason tweeted this morning, the seasonal trend for ticker IBB (iShares Biotechnology ETF) is about to turn favorable. In addition, as you can see in the screenshot below, November is historically the "best" month for IBB.
So does this mean that biotech stocks are sure to soar in the days and weeks ahead? Not at all. But it is a factor on the bullish side of the ledger.
TRADING BIOTECH WITH OPTIONS
One problem with trading XBI shares for many traders is the price tag. At its most recent closing price ($129.59), a trader would need to pony up $12,959 to buy 100 shares. For the sake of example, we will look to "replace" a stock position with an option position.
One thing to focus on when considering trading options is option volume. The greater the volume, typically the more liquid the options, the tighter the bid/ask spread and the better the opportunities. The table below (courtesy of Optionsanalysis) displays the latest daily volume for the most heavily traded (in terms of stock shares) biotech ETFs.
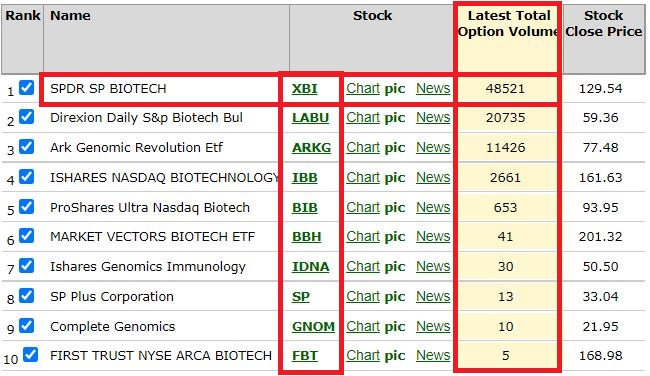 We see that ticker XBI (SPDR S&P Biotech) has by far the greatest option trading volume. So, let's focus our attention there. In this example, we are NOT looking for an exotic options trading strategy that depends on the Greeks or changes in volatility. We simply want to get as close to a long stock position as possible without spending as much as we would to buy 100 shares.
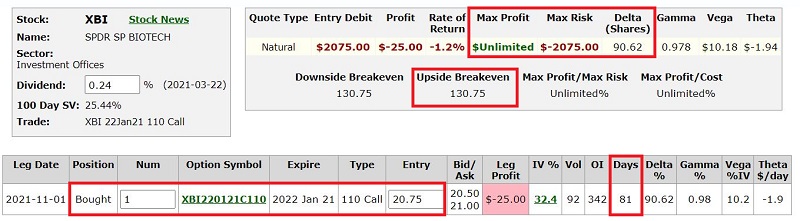
Our example trade is as follows:
- Buy 1 XBI Jan21 2022 110 call @ $20.75
The particulars and risk curves appear in the screenshots below.
 Things to note:
- At the time of entry, this trade has 81 days left until expiration
- Buying a 1 lot gives this trade a delta of 90.62. This means that (for now) this position will behave like a position holding roughly 91 shares of XBI.
- The cost to enter this trade is $2,075 versus $11,788 to buy 91 shares of XBI stock.
- The maximum profit potential is unlimited.
- The maximum risk is -$2,075 if XBI is below $110 a share at option expiration.
- The breakeven price is $130.75 (strike price of 110 + option premium of $20.75). Above this price, the option will move point-for-point with the shares.
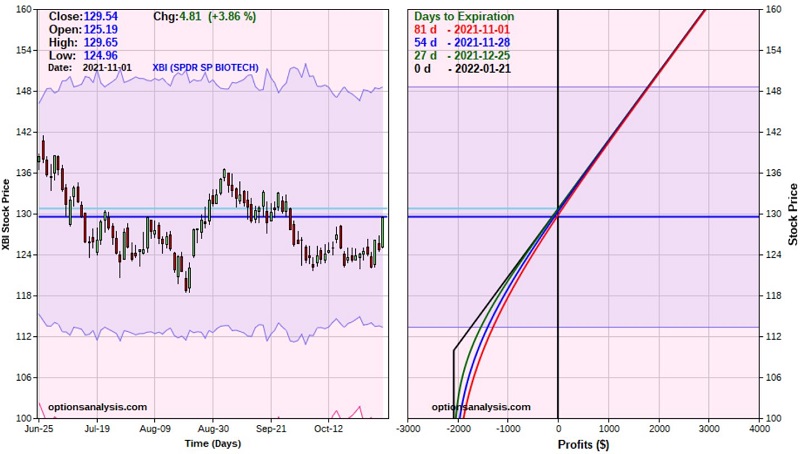
Risk Management: While the maximum risk is $2,075, a trader is not obligated to sit around and accept the maximum loss if XBI decides to decline instead of rising.
As you can see in the chart below, there is a recent low at $118.49. If our trader decides to exit if $118 a share is hit, the loss would be roughly -$977 to -$1,269.
Will this trade work out? Only time will tell. As always, the example trade above is not a recommendation. It merely serves to illustrate the potential to essentially rent a stock equivalent position using options at a fraction of the cost of buying the underlying shares.