Data &
Technology
Research
Reports
Report Solutions
Reports Library
Actionable
Strategies
Free
Resources
Simple Backtest Calculator
Simple Seasonality Calculator
The Kelly Criterion Calculator
Sentiment Geo Map
Public Research Reports
Free Webinar
Pricing
Company
About
Meet Our Team
In the News
Testimonials
Client Success Stories
Contact
Log inLoginSign up
< BACK TO ALL REPORTS

Big-Picture Energy Sector Observations

Dean Christians
2021-10-05
Energy sector momentum is strong. Let's review some big-picture historical charts.

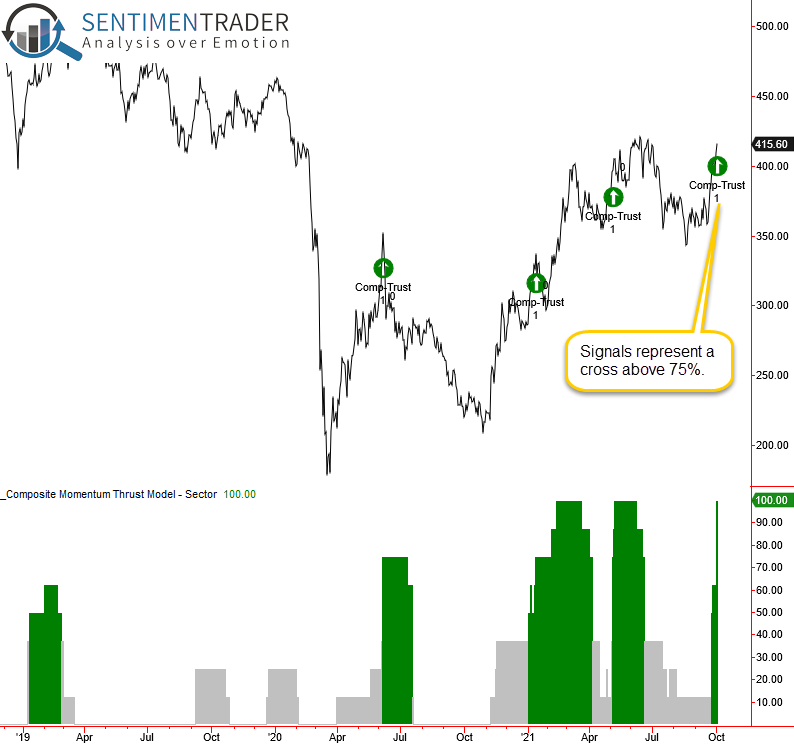
A composite momentum thrust model for the energy sector surged to a signal count of 100% at the close of trading on 10/4/21. If you recall, I last shared the details of the model in a note on 1/15/21.

CURRENT DAY CHART

HISTORICAL CHART

In my note on 1/15/21, the Composite Momentum Thrust Model signal count as a percentage of components crossed above 75%. The count subsequently continued to move higher and finally hit a reading of 100% on 2/16/21. Since the original note, the model has now reached a level of 100% a total of three times. As the chart shows, that's never happened in history. 

When I dropped the signal count to 50% in the original note, forward returns for energy stocks looked below average except for the 2003-08 instances. 
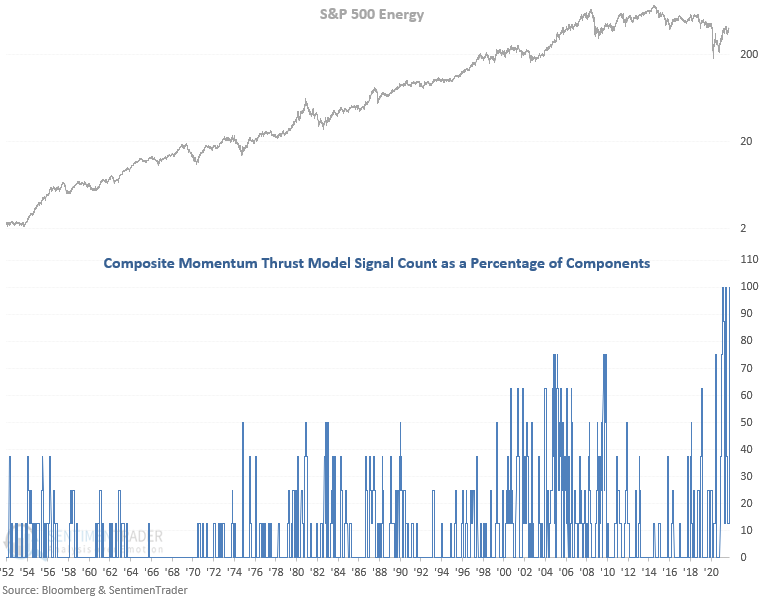

HISTORICAL CHART

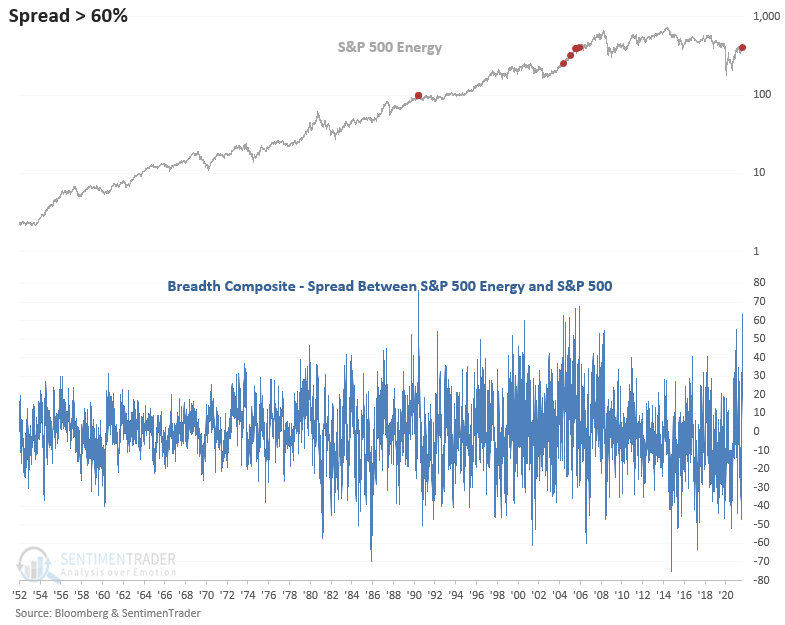
The following chart compares a breadth composite for the energy sector to a breadth composite for the broad market as measured by the S&P 500. The breadth composite contains the following indicators.

  • Percentage of issues above the 10-day moving average
  • Percentage of issues above the 50-day moving average
  • Percentage of issues above the 200-day moving average
  • Percentage Spread Between 21-Day Highs and Lows
  • Percentage Spread Between 63-Day Highs and Lows
  • Percentage Spread Between 252-Day Highs and Lows

The spread between the two breadth composites surged to the highest level since September 2005 on 10/4/21.

HISTORICAL CHART

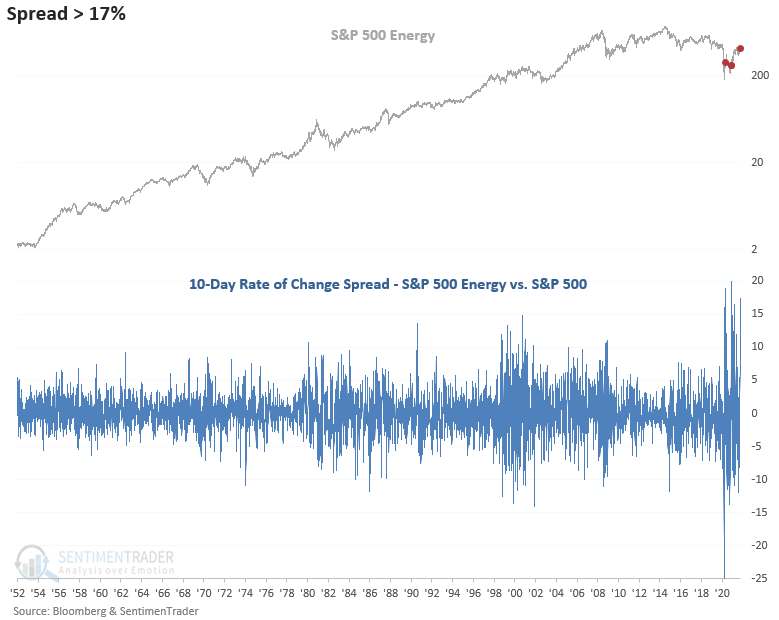
Let's compare a 10-day rate of change for the energy sector to a 10-day rate of change for the S&P 500. We see that over the most recent trailing ten-day period ending on 10/4/21, the spread crossed above the third-highest level since 1952.

HISTORICAL CHART

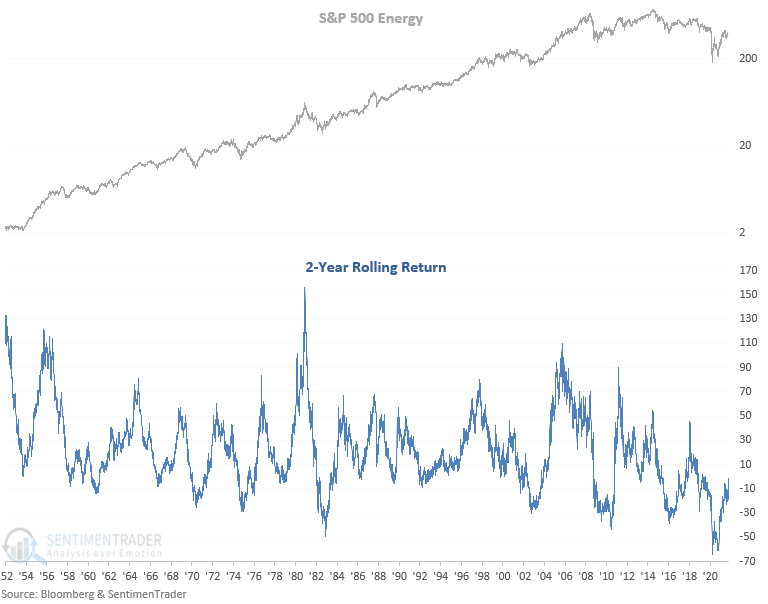
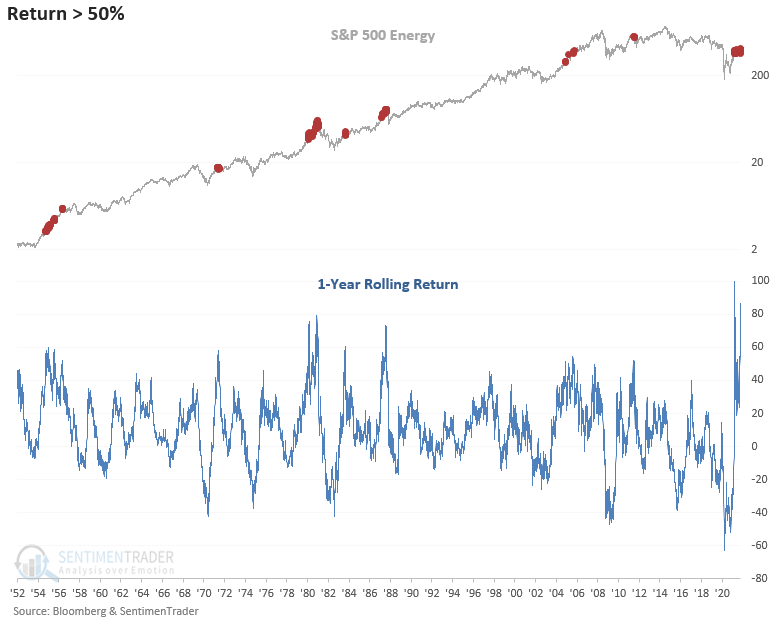
The 1-year rolling return for the energy sector shows the largest increase in history since the pandemic low.

HISTORICAL CHART

However, the 2-year rolling return for the energy sector is still negative. And, it remains well below other historical instances that preceded a market peak.


Sorry, you don't have access to this report

Upgrade your subscription plan to get access
Go to Dasboard
DATA &
TECHnologies
IndicatorEdge
‍
BackTestEdge
‍
Other Tools
‍
DataEdge API
RESEARCH
reports
Research Solution
‍
Reports Library
‍
actionable
Strategies
Trading Strategies
‍
Smart Stock Scanner
‍
FREE
RESOUrCES
Simple Backtest
Calculator
Simple Seasonality
Calculator
The Kelly Criterion
Calculator
Sentiment Geo Map
‍
Public Research Reports
‍
Free Webinar
COMPANY
‍
About
‍
Meet our Team
‍
In the News
‍
Testimonials
‍
Client Success Stories
Pricing
Bundle pricing
‍
Announcements
‍
FAQ
© 2024 Sundial Capital Research Inc. All rights reserved.
Setsail Marketing
TermsPrivacyAffiliate Program
Risk Disclosure: Futures and forex trading contains substantial risk and is not for every investor. An investor could potentially lose all or more than the initial investment. Risk capital is money that can be lost without jeopardizing ones’ financial security or life style. Only risk capital should be used for trading and only those with sufficient risk capital should consider trading. Past performance is not necessarily indicative of future results.

Hypothetical Performance Disclosure: Hypothetical performance results have many inherent limitations, some of which are described below. No representation is being made that any account will or is likely to achieve profits or losses similar to those shown; in fact, there are frequently sharp differences between hypothetical performance results and the actual results subsequently achieved by any particular trading program. One of the limitations of hypothetical performance results is that they are generally prepared with the benefit of hindsight. In addition, hypothetical trading does not involve financial risk, and no hypothetical trading record can completely account for the impact of financial risk of actual trading. for example, the ability to withstand losses or to adhere to a particular trading program in spite of trading losses are material points which can also adversely affect actual trading results. There are numerous other factors related to the markets in general or to the implementation of any specific trading program which cannot be fully accounted for in the preparation of hypothetical performance results and all which can adversely affect trading results.

Testimonial Disclosure: Testimonials appearing on this website may not be representative of other clients or customers and is not a guarantee of future performance or success.