Data &
Technology
Research
Reports
Report Solutions
Reports Library
Actionable
Strategies
Free
Resources
Simple Backtest Calculator
Simple Seasonality Calculator
The Kelly Criterion Calculator
Sentiment Geo Map
Public Research Reports
Free Webinar
Pricing
Company
About
Meet Our Team
In the News
Testimonials
Client Success Stories
Contact
Log inLoginSign up
< BACK TO ALL REPORTS

Bending the curve

Jason Goepfert
2021-02-18
The 2-year / 10-year Treasury yield curve has become the steepest in 5 years with the recent move in bonds. Opinions vary on the meaning, but the recent record has been negative for stocks (especially tech stocks) while good for gold.

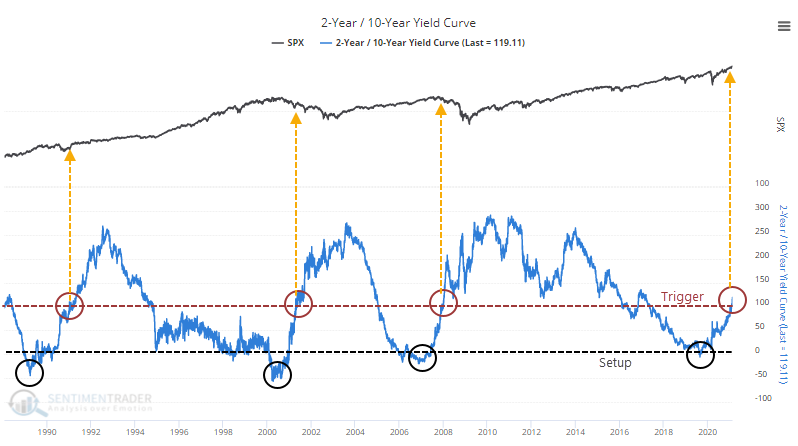
The U.S. Treasury market has seen some stiff selling pressure in recent days, on the heels of stiff selling in recent months. As a result, the benchmark 2-year / 10-year yield curve is the steepest in almost 5 years.

Whether this is a good thing or a bad thing depends upon whom you ask. Bulls will say it's a sign of recovery and good for financials, the bedrock of any sustainable rally. Bears will say it's the first prick in the TINA bubble that will clobber tech stocks, which have been powering most of the gains.

Opinions are a dime a dozen, so let's just objectively look at prior instances and see how things shook out.

There is no definitive date when the Federal Reserve explicitly began targeting the Fed Funds rate but academic literature seems to point to anywhere from 1982 to late 1987. So we'll go from there. 

With the yield curve, we'll use a setup and a trigger. The setup is when it drops toward or below 0, with the trigger being when it rises to its current level over 110 basis points.

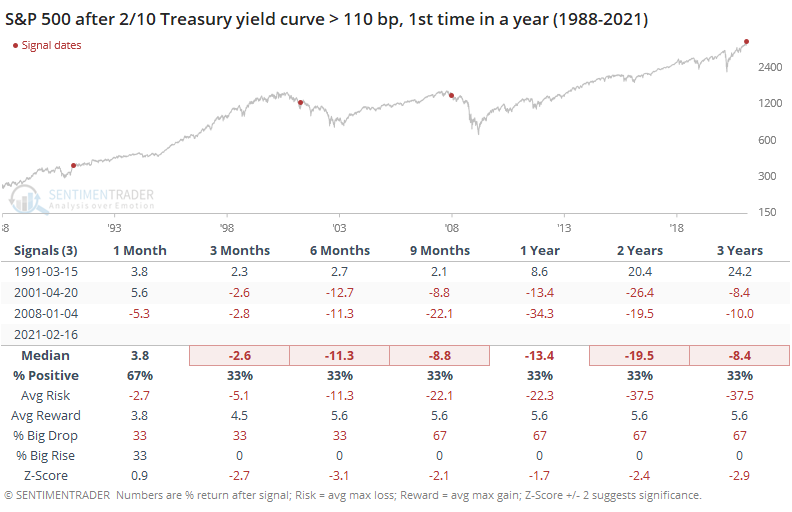
On a chart, it looks pretty ugly for the S&P 500. The numbers don't look especially great, either.


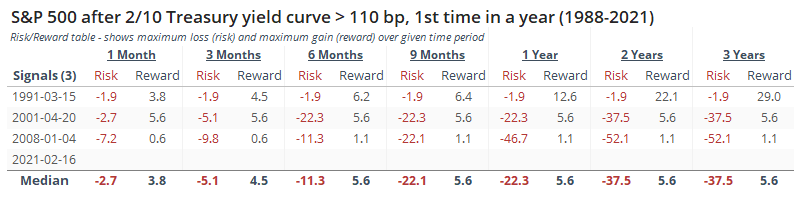
The Risk/Reward Table shows more of the former and less of the latter, though in '91 it didn't lead to any large decline, so there's that.

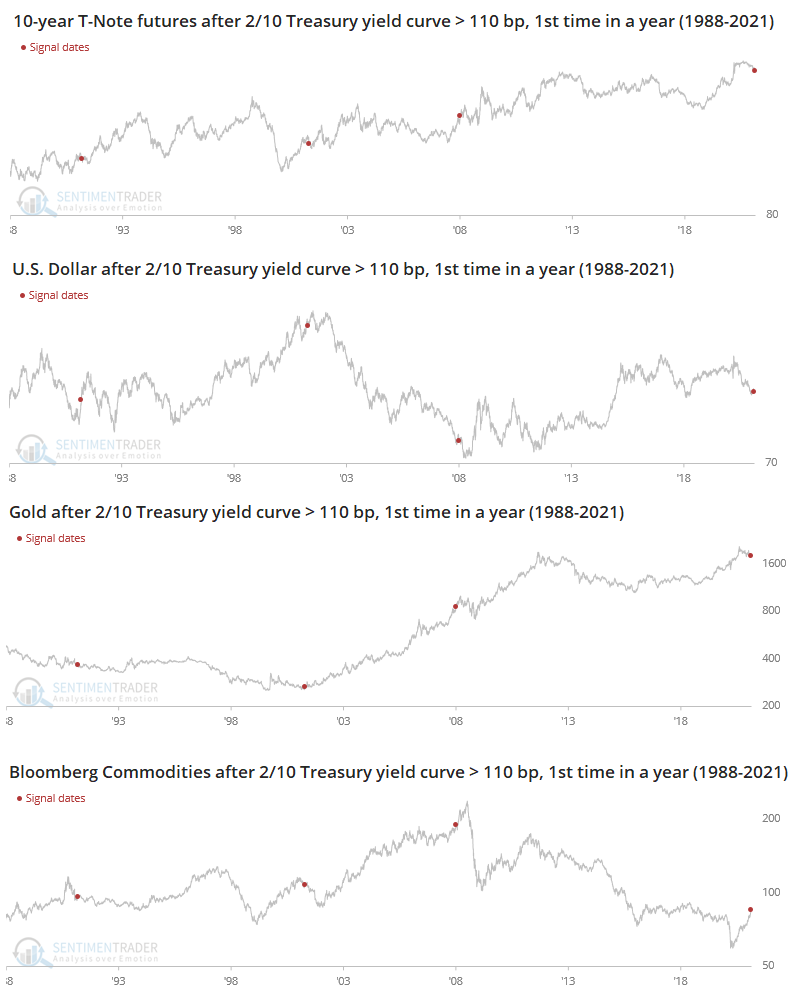
Among major assets, stocks were the worst performer. Gold held up best - over the next 2 years, its average drawdown was -10.4% versus an average maximum gain of +41.4%.

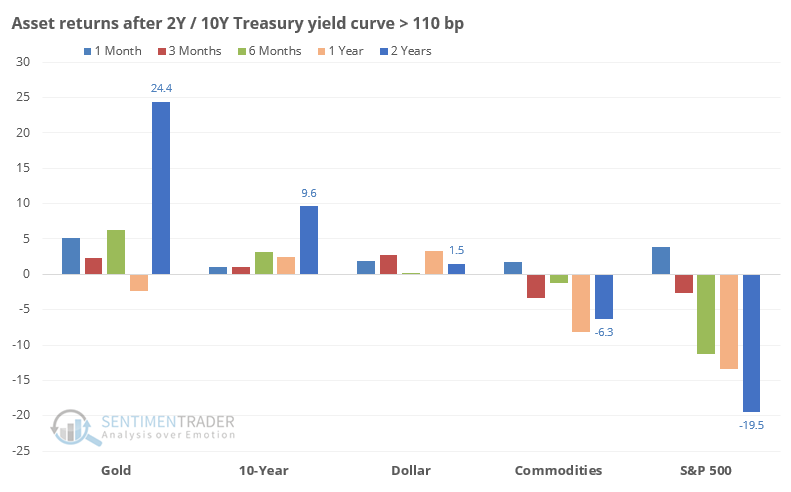
Sometimes it's easier to see it on a chart, so the four other assets are shown below.

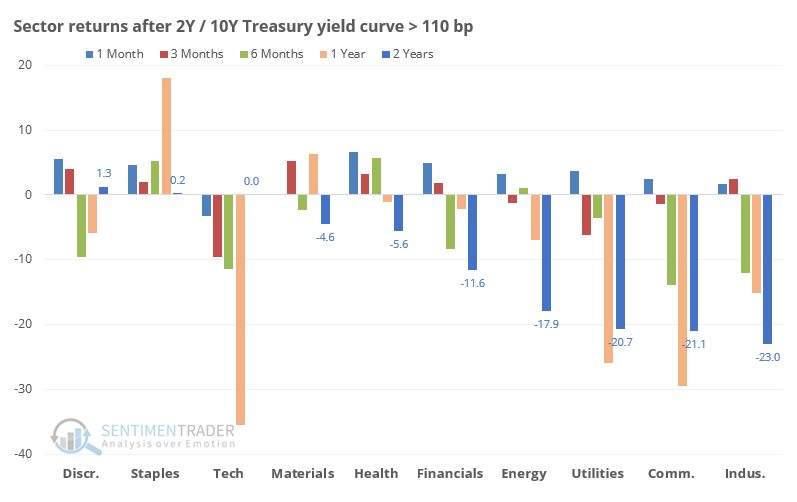
Among sectors, Staples held up the best across most time frames, while Tech, Utilities, Communications, and Industrials tended to fare the worst. Technology was the only sector to show losses over the next 3, 6, and 9 months after all 3 signals, averaging -9.6%, -11.5%, and -18.7%, respectively. Its average one-year return was -35.6% but by 2 years later had recovered to breakeven. Note that these are using total return, including dividends.

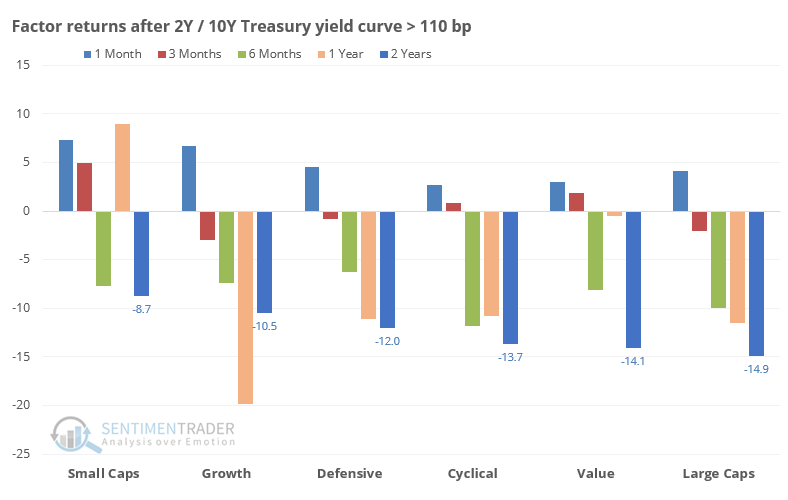
A look at factors shows mostly consistent negative returns. Small-caps were the least consistent losers, while large-caps were the most consistent losers.

With a small sample size and some disagreement among them, it's hard to put too much weight on this move in the yield curve. It's tempting to just look at the last two signals and conclude that it's a major negative, but markets just aren't that easy. We would put it more on the negative side of the ledger than the positive one, especially for technology stocks, but it's not compelling enough to include it as a major factor.

Sorry, you don't have access to this report

Upgrade your subscription plan to get access
Go to Dasboard
DATA &
TECHnologies
IndicatorEdge
‍
BackTestEdge
‍
Other Tools
‍
DataEdge API
RESEARCH
reports
Research Solution
‍
Reports Library
‍
actionable
Strategies
Trading Strategies
‍
Smart Stock Scanner
‍
FREE
RESOUrCES
Simple Backtest
Calculator
Simple Seasonality
Calculator
The Kelly Criterion
Calculator
Sentiment Geo Map
‍
Public Research Reports
‍
Free Webinar
COMPANY
‍
About
‍
Meet our Team
‍
In the News
‍
Testimonials
‍
Client Success Stories
Pricing
Bundle pricing
‍
Announcements
‍
FAQ
© 2024 Sundial Capital Research Inc. All rights reserved.
Setsail Marketing
TermsPrivacyAffiliate Program
Risk Disclosure: Futures and forex trading contains substantial risk and is not for every investor. An investor could potentially lose all or more than the initial investment. Risk capital is money that can be lost without jeopardizing ones’ financial security or life style. Only risk capital should be used for trading and only those with sufficient risk capital should consider trading. Past performance is not necessarily indicative of future results.

Hypothetical Performance Disclosure: Hypothetical performance results have many inherent limitations, some of which are described below. No representation is being made that any account will or is likely to achieve profits or losses similar to those shown; in fact, there are frequently sharp differences between hypothetical performance results and the actual results subsequently achieved by any particular trading program. One of the limitations of hypothetical performance results is that they are generally prepared with the benefit of hindsight. In addition, hypothetical trading does not involve financial risk, and no hypothetical trading record can completely account for the impact of financial risk of actual trading. for example, the ability to withstand losses or to adhere to a particular trading program in spite of trading losses are material points which can also adversely affect actual trading results. There are numerous other factors related to the markets in general or to the implementation of any specific trading program which cannot be fully accounted for in the preparation of hypothetical performance results and all which can adversely affect trading results.

Testimonial Disclosure: Testimonials appearing on this website may not be representative of other clients or customers and is not a guarantee of future performance or success.