
Bearish to Bullish Volatility Reversal Buy Signal

A Volatility Index VIX Futures bearish to bullish reversal signal triggered after the close of trading on 3/17/21. Normally, volatility reversal signals occur after more substantial corrections in the broad market and when equity indexes are still trading below a high. While the S&P 500 corrected a modest amount, several growth-oriented groups experienced more substantial downside moves that contributed to a spike in volatility.
VIX Futures Range Rank Reversal Buy Signal
The VIX Futures Range Rank signal seeks to identify instances in history when the 4-month range rank for the VIX Futures Continuous Contract #6 reverses from a period of high volatility to low volatility. The model will issue an alert based upon the following conditions.
Signal Criteria
Condition1 = 4-month range rank crosses above 99
Condition2 = 4-month range rank crosses below 45.5
Condition3 = If Condition2, start days since true count
Condition4 = If Days since true count <= 10, and the SPY 5-day rate of change is > 0%, then buy.
Let's take a look at some historical charts and signal performance.
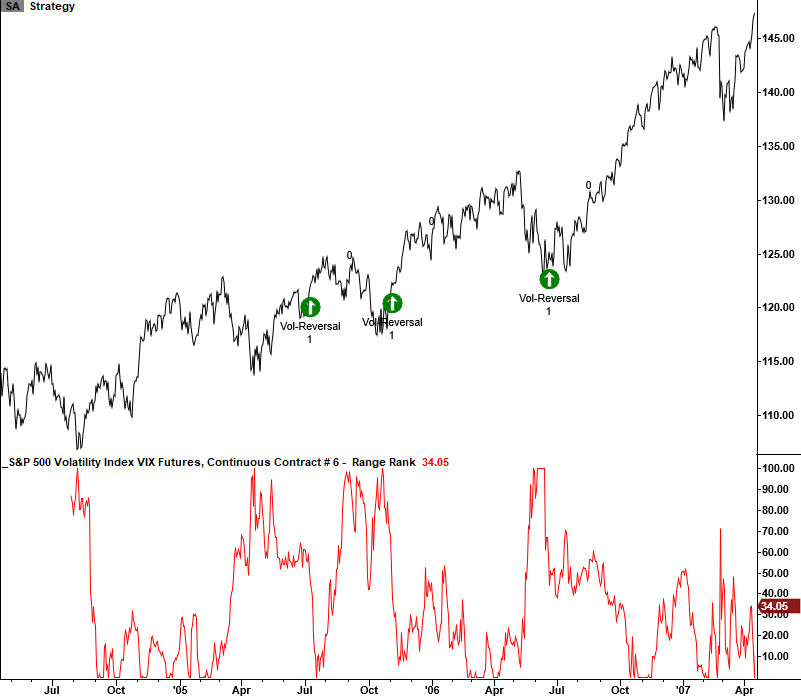
Volatility Reversal Chart Example
Volatility Reversal Chart Example
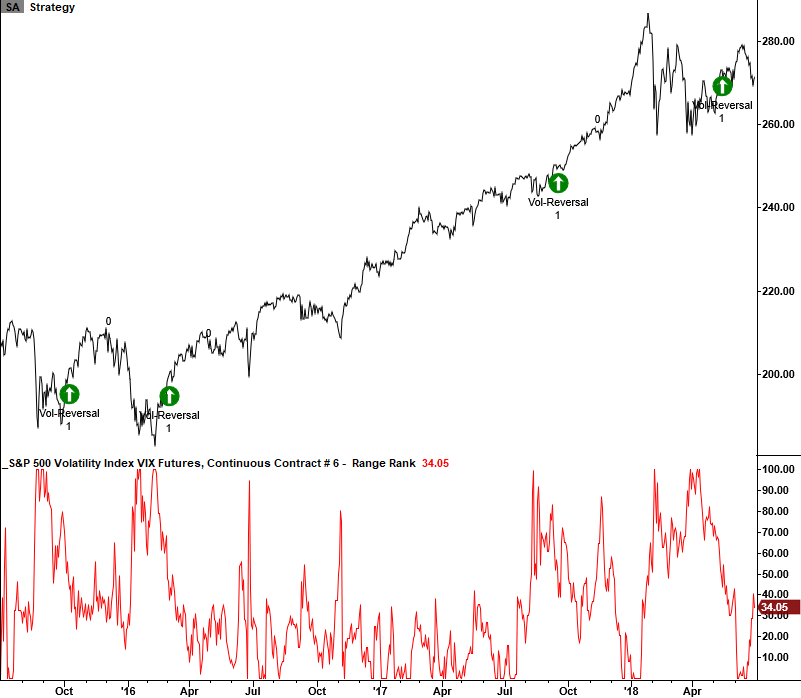
Volatility Reversal Chart Example
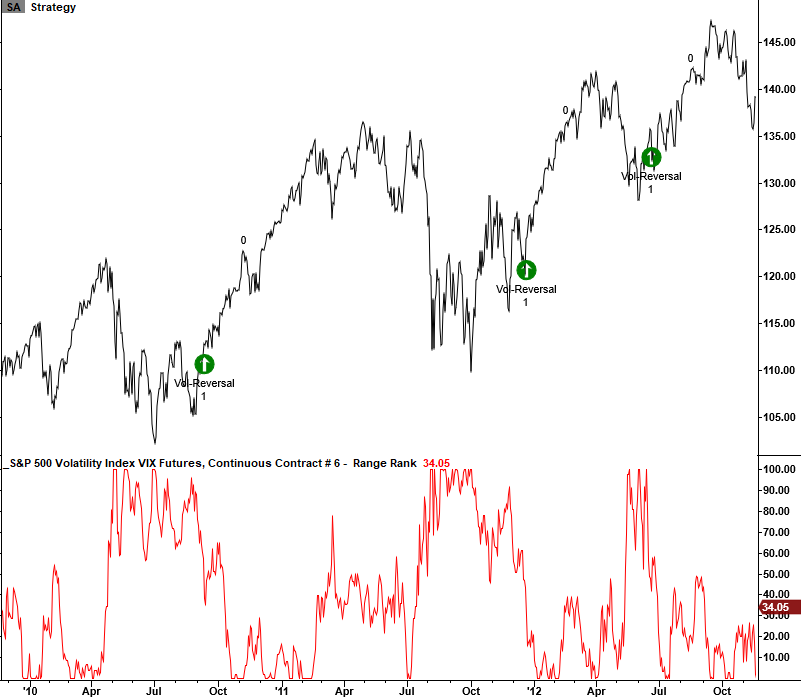
Volatility Reversal Chart Example
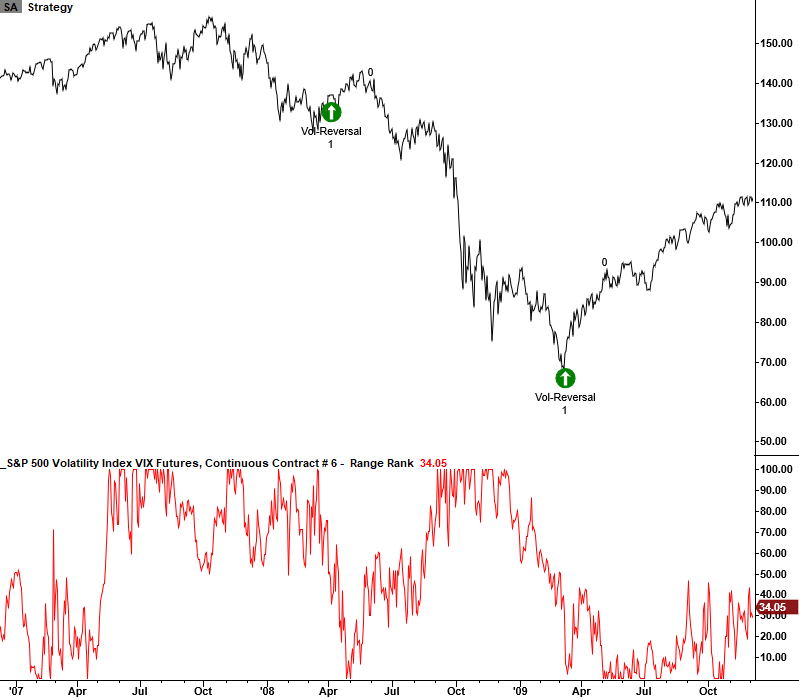
Volatility Reversal Chart Example
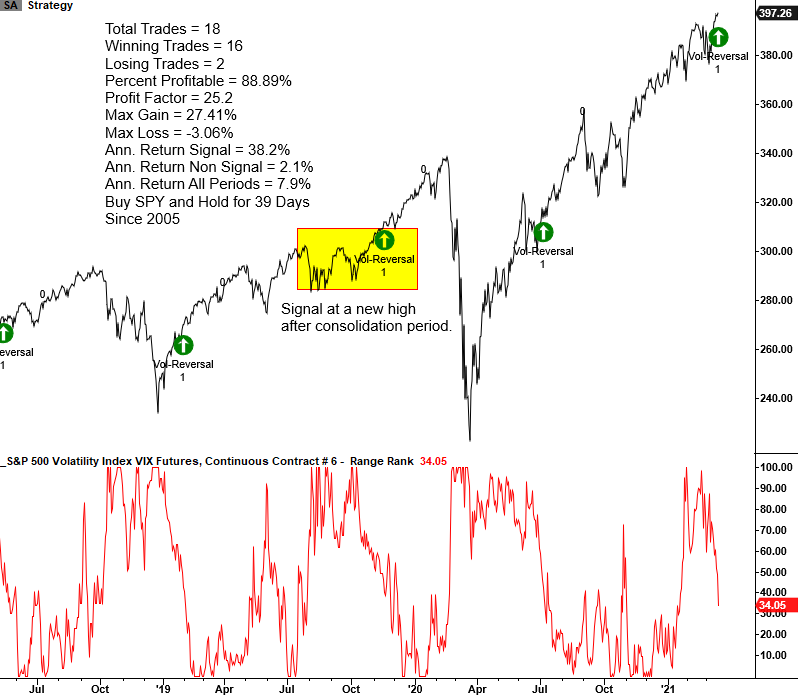
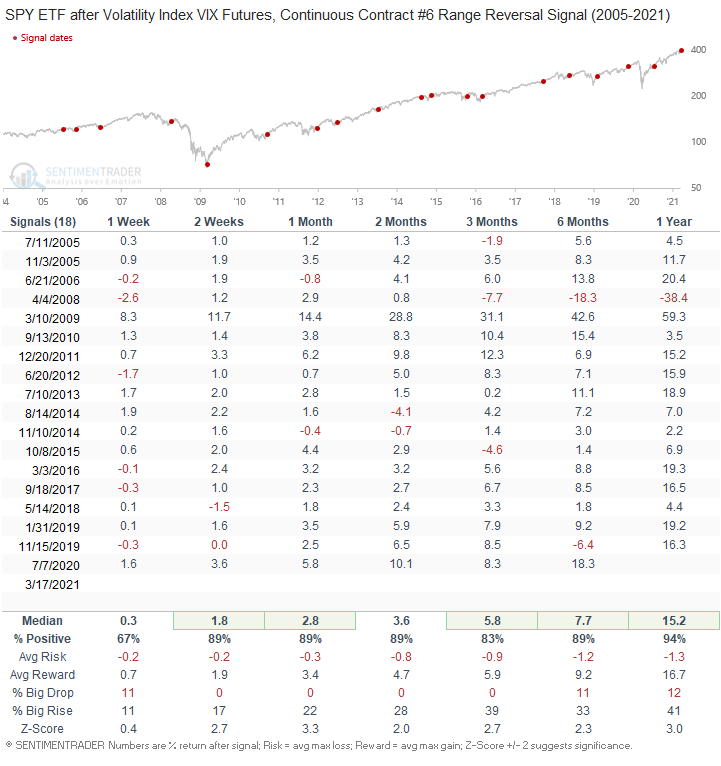
Volatility Reversal Signal Performance
The performance results look solid. However, the latest signal occurred at a 252-Day High. Signals at a high have only occurred two other times. I would not expect performance to be as robust.
Notes
The VIX Futures Continuous Contract #6 was selected as the vehicle of choice for identifying a volatility reversal signal after an optimization process.
VIX Futures data has a limited history.
Bloomberg symbol - UX6 Index
Quandl symbol - VX6
Website Disclosure
"We do not provide investment advice. Our goal is always to find some practical angle, but what you do with the research is up to you. By no means is it ever suggested that you make a trade or investment based on a single reference; we consider our research to be only one part of what should be a comprehensive investment philosophy that includes fundamental and technical data."