
Bearish GLD traders create bullish scenario for GLD traders

Key points
- Trader sentiment for the SPDR Gold Trust (GLD) just touched an extreme level
- This has tended to portend higher prices two months later
- Seasonality, trend, and momentum stand as potential headwinds
Historically, the gold hype exceeds the promise
I have somewhat cynically started referring to gold in recent years as the market that never misses an opportunity to miss an opportunity. Since the late 1970's gold pundits have promoted the yellow metal as "a store of value" and a "hedge against uncertainty," and forecasts of "Gold $3,000" can be found easily. These claims are questionable. On many occasions when stocks and/or bonds have experienced turmoil, gold either did very little or followed suit - i.e., missing the opportunity to live up to its ballyhooed promise. That said, if we arbitrarily pick 2021-12-31 as a starting date, gold has, in fact, held up pretty well, as shown below:
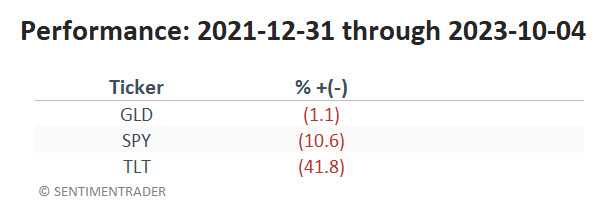
That's the good news. The bad news is that a return of -1.1% over 21+ months is not exactly what we were promised by those touting gold all these years. Conversely, gold arguably completed a triple top formation in May this year and is now down almost -12% from its highs. Also, GLD has dropped back below its 200-day moving average, and that average is on the verge of rolling over.
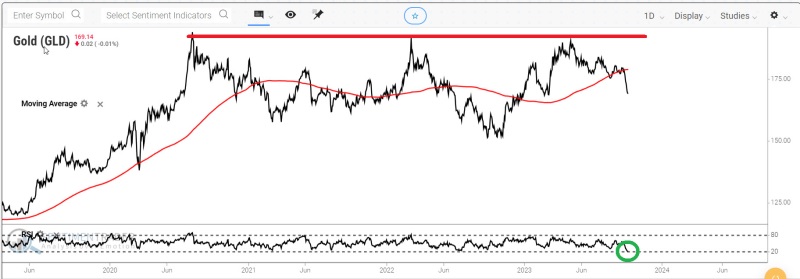
One potentially positive development is that the 14-day RSI for ticker GLD is now deeply oversold at 20.6. However, the indicator we will highlight in this piece is the recent decline in bullishness among GLD traders.
GLD Optix flashes a potentially favorable signal
Our GLD Optix indicator is based on data including:
- Trading activity in put options versus call options
- Future volatility expectations
- Average discount of the fund to its NAV
- Price behavior
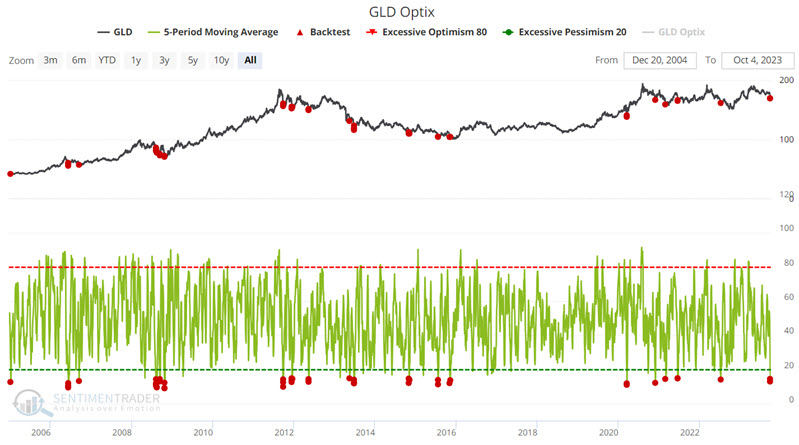
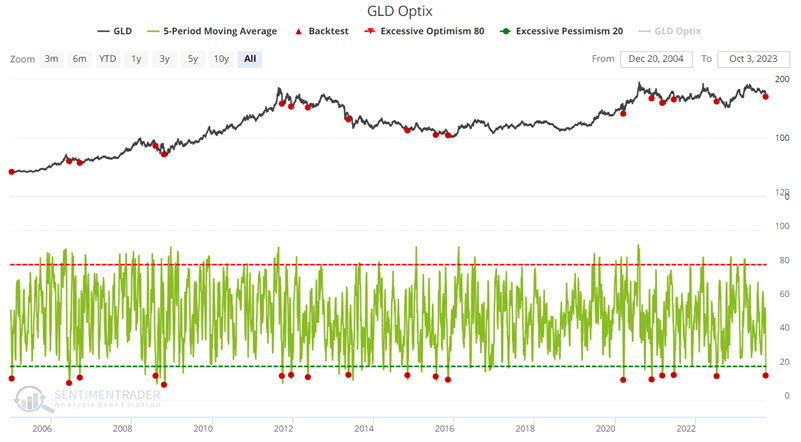
Each measure is ranked against its historical norms to determine whether or not the current level is at an extreme, then totaled to come up with an overall score. The Optix can go from 0 (maximum pessimism) to 100 (maximum optimism), though it generally stays above 20 and below 80.
We use a 5-day moving average of daily GLD Optix readings for the test below. The chart below highlights all dates when the 5-day GLD Optix average was below 15% (i.e., 85% of traders have been bearish over the last five days). The most recent signal occurred on 2023-10-02.
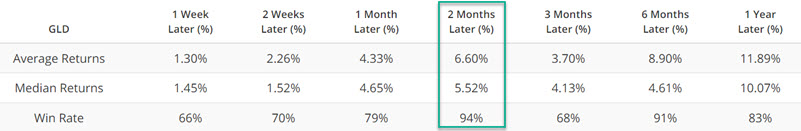
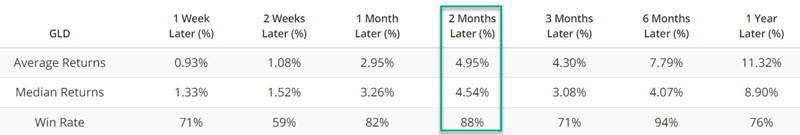
The table below summarizes subsequent GLD performance. The most notable result is the 94% Win Rate with a Median Return of +5.52%.
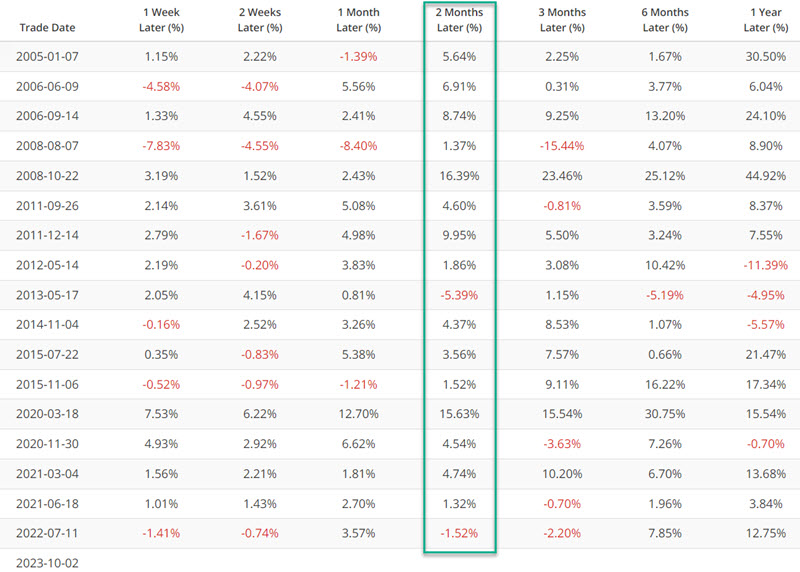
The results above include overlapping readings below 15%. Let's remove overlapping signals to get a better idea of potential real-world trading results. The chart below highlights only those dates when the 5-day GLD Optix average was below 15% for the first time in two months.
The tables below summarize GLD performance and signal-by-signal results.
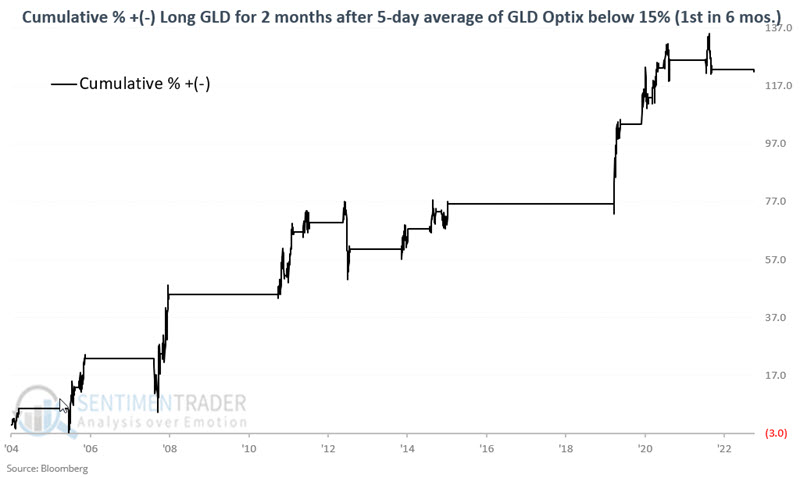
The chart below displays the hypothetical cumulative % growth from holding a long position in GLD shares for 42 trading days after each signal date shown in the table above. Make of these results what you will.
One potential headwind: Seasonality
Seasonality is climate, not weather, and does not constitute a "roadmap," only an average of previous tendencies. While it can be considered a factor when making trading decisions, it should rarely be relied upon 100%. The reason for all this rhetoric regarding seasonality is that gold has demonstrated a historical tendency to show weakness during October (gold stocks have historically shown much more significant October weakness than gold bullion). The chart below displays the annual seasonal trend for gold futures.
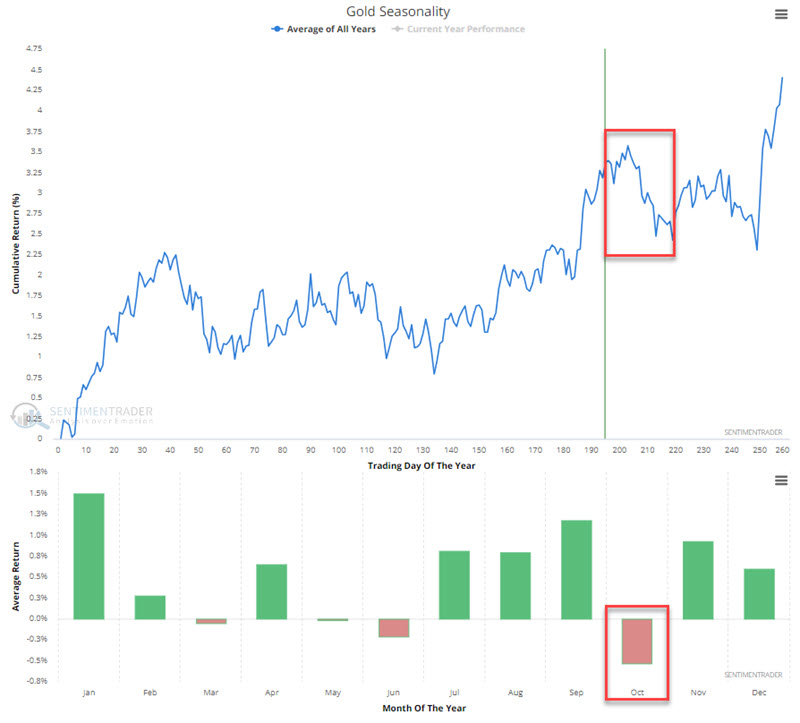
For the record, gold futures have declined in October 27 times in the past 48 years (i.e., 44% of the time up, 56% of the time down). The average and median returns for October are -0.63% and -0.41%, respectively.
Ticker GLD has a shorter history, as it started trading in 2004. For the record, ticker GLD has been up nine times and down nine times during October since inception. The average and median returns for October are +0.05% and +0.48%, respectively.
Some thoughts on real-world trading
Taking a long position in GLD in the face of its recent plunge must be considered a "high risk, countertrend" speculative position. A trader considering such a position must recognize that they are essentially trying to catch a falling knife. It's a great trick when it works, but obvious dangers are involved. The primary considerations must be a) how much capital to allocate, b) when to cut a loss, and c) when to take a profit. The primary key to trading high-risk, countertrend trades is to keep capital allocations relatively small - i.e., DO NOT "bet the ranch" hoping for a giant "killing." Next is setting a reasonable percent of allocated capital to risk and placing a stop-loss order. If the trade gets stopped out, the trader loses no more than an acceptable amount and moves on to the next trade.
Finally, some advance thought should be given to profit-taking. While the information above implies a two-month holding period, an alert trader might consider taking profit on some or all of their allocation if a decent profit accrues quickly. There are no "correct" answers to these questions, just decisions to be made and results to be lived with. The primary point is that it is better to have a plan of action set in advance than to merely "react" and trust one's gut in the heat of the battle.
What the research tells us…
Ticker GLD is presently oversold, and trader sentiment has reached a level that has often preceded a bounce in price in the past. That said, buying into a sharp decline - particularly into a potential triple top, a newly forming downtrend, and potentially unfavorable seasonality - is an exercise fraught with peril. Nevertheless, the opportunity is where you find it. Anyone considering playing the long side of GLD should carefully review the thoughts on real-world trading above and develop a specific trading plan.