Data &
Technology
Research
Reports
Report Solutions
Reports Library
Actionable
Strategies
Free
Resources
Simple Backtest Calculator
Simple Seasonality Calculator
The Kelly Criterion Calculator
Sentiment Geo Map
Public Research Reports
Free Webinar
Pricing
Company
About
Meet Our Team
In the News
Testimonials
Client Success Stories
Contact
Log inLoginSign up
< BACK TO ALL REPORTS

Basic Materials stocks have stormed back

Jason Goepfert
2022-11-14
Not even two months ago, every Basic Material stock was trading below its 50-day moving average. Now, every one of them is above its average. Over the past 70 years, similar cycles from famine to feast preceded excellent gains for the sector.

Key points:

  • Less than two months ago, every Material stock was in a medium-term downtrend
  • By Friday, every one of them was back above its 50-day moving average
  • Similar cycles over the past 70 years preceded tremendous gains for the sector

From 0 to 100

It's been a heck of a couple of weeks, including a sector most investors ignore. Out of all the sectors and indexes we track, none have more members in medium-term uptrends than Basic Materials.

Populated by companies like Linde, Sherwin-Williams, and Ecolab, they are exposed to the pedestrian workings of an economy. 

It would be impossible for more of these stocks to be trading above their 50-day moving averages because every one of them is. It's a dramatic turnaround from less than two months ago when every one of the stocks was below its 50-day average.

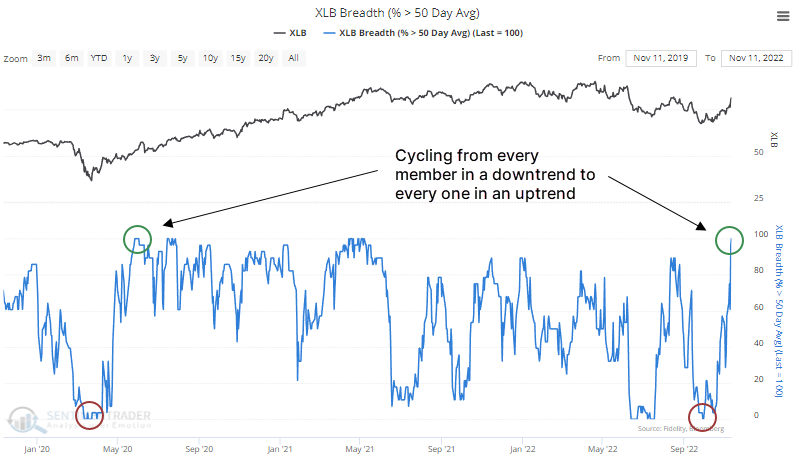
Over the past 70 years, only a handful of times has the sector undergone such a dramatic shift in fortunes within six months. The table below shows every time since 1952 when, within six months, every stock was below its average, then every one was above.

The current shift is the 2nd-fastest in history, next to May 1980. It even beat out the pandemic recovery. It was a good sign for future returns, as all of the dates showed a positive total return over the next 2-12 months.

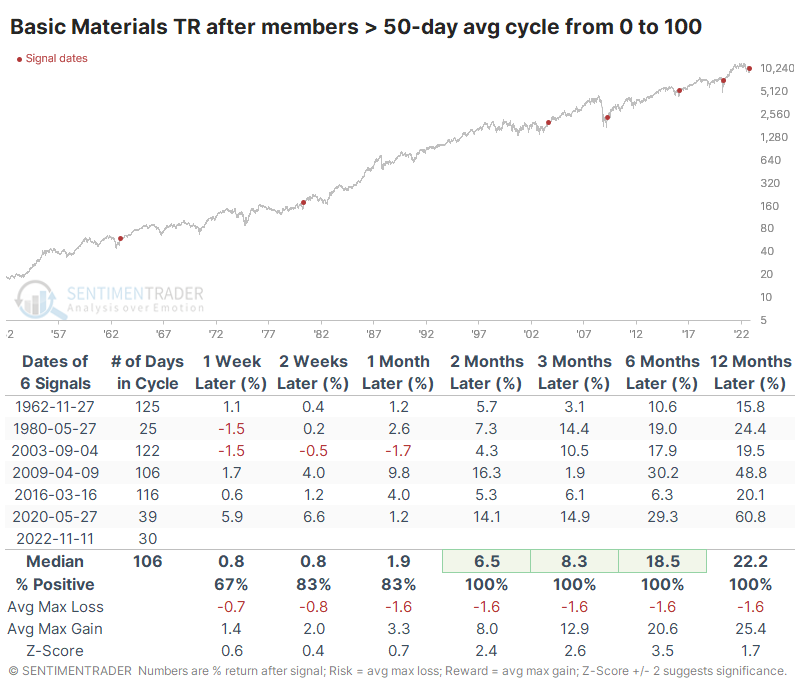
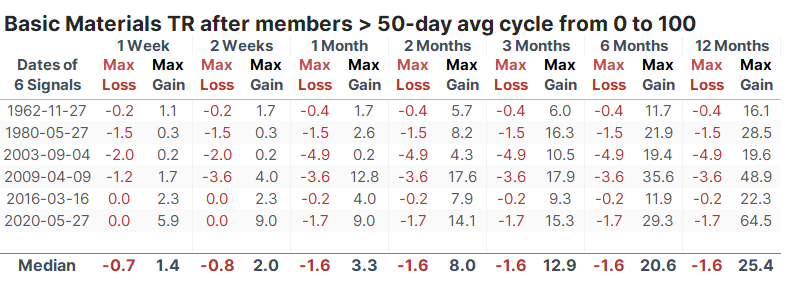
The returns in the table are impressive, though with a tiny sample size. What makes the signals more compelling is consistency. At no point within the following year did any of them suffer more than a -5% drawdown, while all enjoyed gains of at least +15%.

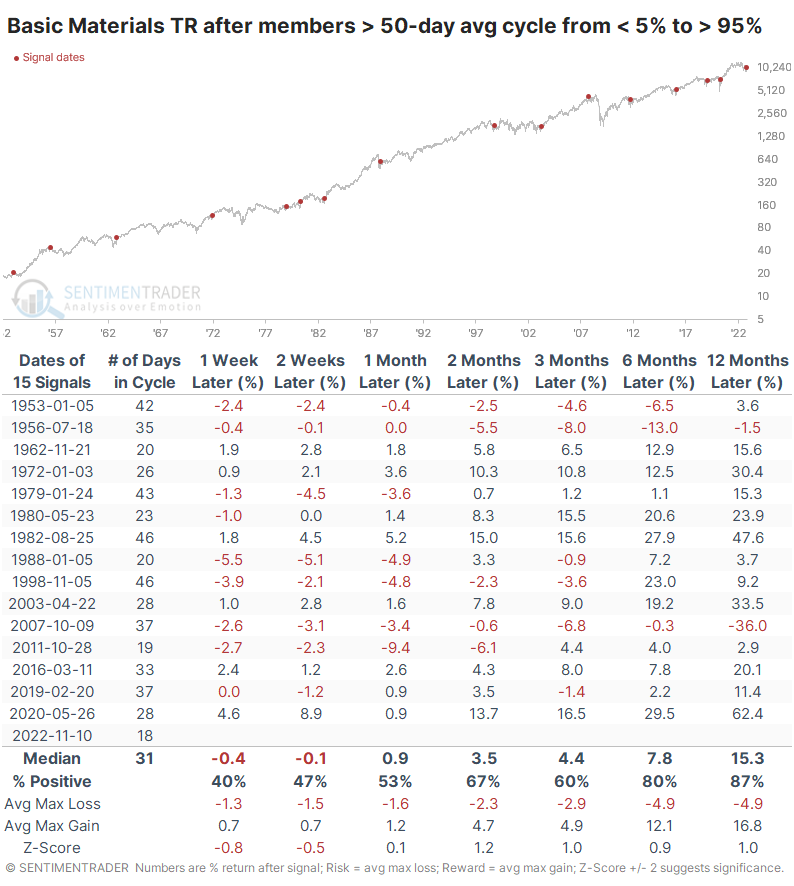
If we lessen the parameters but tighten the cycle length, we can generate a larger sample size. The table below shows times when the members above their 50-day moving average cycled from fewer than 5% to more than 95% within three months.

There were two outright failures, in 1956 and 2007, but those were also among the few that triggered when the sector was trading at or near a new high, which is not the case now.

What the research tells us...

As we saw with Industrial stocks, some of the more staid sectors are enjoying tremendous interest among investors. While that may not be the best sign for the broader market, it has tended to be a good sign of long-term momentum for the sectors themselves. They have rarely, if ever, declined in the 6-12 months following a resurgence of interest like they've enjoyed over the past couple of months.

DATA &
TECHnologies
IndicatorEdge
‍
BackTestEdge
‍
Other Tools
‍
DataEdge API
RESEARCH
reports
Research Solution
‍
Reports Library
‍
actionable
Strategies
Trading Strategies
‍
Smart Stock Scanner
‍
FREE
RESOUrCES
Simple Backtest
Calculator
Simple Seasonality
Calculator
The Kelly Criterion
Calculator
Sentiment Geo Map
‍
Public Research Reports
‍
Free Webinar
COMPANY
‍
About
‍
Meet our Team
‍
In the News
‍
Testimonials
‍
Client Success Stories
Pricing
Bundle pricing
‍
Announcements
‍
FAQ
© 2024 Sundial Capital Research Inc. All rights reserved.
Setsail Marketing
TermsPrivacyAffiliate Program
Risk Disclosure: Futures and forex trading contains substantial risk and is not for every investor. An investor could potentially lose all or more than the initial investment. Risk capital is money that can be lost without jeopardizing ones’ financial security or life style. Only risk capital should be used for trading and only those with sufficient risk capital should consider trading. Past performance is not necessarily indicative of future results.

Hypothetical Performance Disclosure: Hypothetical performance results have many inherent limitations, some of which are described below. No representation is being made that any account will or is likely to achieve profits or losses similar to those shown; in fact, there are frequently sharp differences between hypothetical performance results and the actual results subsequently achieved by any particular trading program. One of the limitations of hypothetical performance results is that they are generally prepared with the benefit of hindsight. In addition, hypothetical trading does not involve financial risk, and no hypothetical trading record can completely account for the impact of financial risk of actual trading. for example, the ability to withstand losses or to adhere to a particular trading program in spite of trading losses are material points which can also adversely affect actual trading results. There are numerous other factors related to the markets in general or to the implementation of any specific trading program which cannot be fully accounted for in the preparation of hypothetical performance results and all which can adversely affect trading results.

Testimonial Disclosure: Testimonials appearing on this website may not be representative of other clients or customers and is not a guarantee of future performance or success.