Data &
Technology
Research
Reports
Report Solutions
Reports Library
Actionable
Strategies
Free
Resources
Simple Backtest Calculator
Simple Seasonality Calculator
The Kelly Criterion Calculator
Sentiment Geo Map
Public Research Reports
Free Webinar
Pricing
Company
About
Meet Our Team
In the News
Testimonials
Client Success Stories
Contact
Log inLoginSign up
< BACK TO ALL REPORTS

Bad surprises and the probability of a bear market

Jason Goepfert
2020-03-30
A Goldman Sachs model estimating the likelihood of a further 20% decline is on track to plunge. Economic surprises have made a historic drop.

Bear market probabilities

Back in the fall of 2018, we looked at the dangerous condition of the Bear Market Probability Model. At the time, it suggested an 80% chance of a bear market ahead, one of the highest readings since 1950.

The model, outlined originally by Goldman Sachs, uses five fundamental inputs. Each month's reading is ranked versus all other historical readings and assigned a score. The higher the score, the higher the probability of a bear market in the months ahead.

Don't get too hung up on the name (we're already in the midst of a bear market), the only purpose of the model is to try to assign a likelihood to a further 20% or larger drop within the next year. Based on the latest estimates, the model could plunge to below 40%.

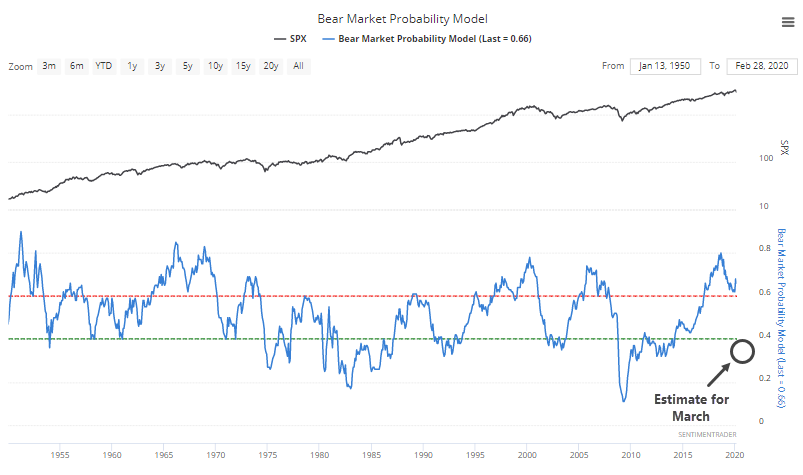
This depends very much on how accurate the economic numbers will be for this month, and whether it will take at least another month for some of them to reflect the current situation of high unemployment.

By the time things get so bad that the model falls below 40%, future one-year returns averaged more than 22% and with a single failure.


A better use for RSI

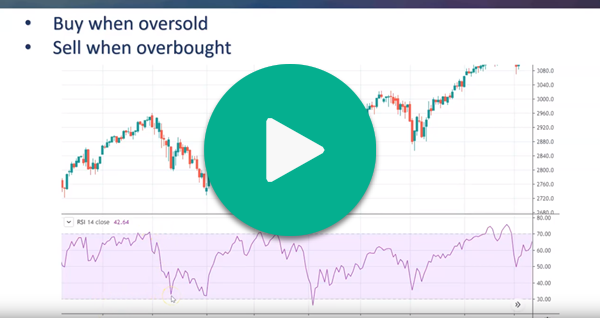
One of the most popular technical indicators is the Relative Strength Index (RSI). Unfortunately, that's also part of the problem. So many analysts look at it the same way, and use interpretations that sound good based on theory or what old textbooks say should work. They don't.

In this video, we introduce a unique way to interpret the indicator incorporating sentiment, and put hard numbers to whether this can be effective. Click here to see how you can improve the indicator.


Bad surprises

March is almost over, which means that economic data released in early-April (labor report + ISM) will probably be extremely negative. This is to be expected, and one wonders how much of the bad news is baked into markets already. Unemployment will definitely jump, seeing how awful Initial Claims was this week.

Terrible Initial Claims data + other weak economic data caused the U.S. Citigroup Economic Surprise Index to crater over the past 3 days. When the Economic Surprise Index fell at least -35 over 3 days, the S&P typically rallied over the next month. 

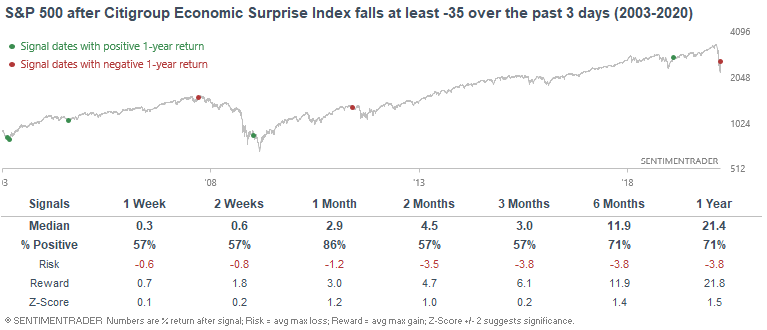
The index is more useful for predicting gold, the U.S. Dollar Index, and bonds, some of which have seen more consistent results after extremes in surprises.

This is an abridged version of our recent reports and notes. For immediate access with no obligation, sign up for a 30-day free trial now.

We also looked at:

  • What happens after big weekly reversals in the S&P, and selling climaxes in its stocks
  • Advisor and investor sentiment is getting very low
  • Oil has had a historic rout
  • No place to hide as 60/40 portfolios get hammered
  • Consumer confidence in stocks has plunged by a record amount
DATA &
TECHnologies
IndicatorEdge
‍
BackTestEdge
‍
Other Tools
‍
DataEdge API
RESEARCH
reports
Research Solution
‍
Reports Library
‍
actionable
Strategies
Trading Strategies
‍
Smart Stock Scanner
‍
FREE
RESOUrCES
Simple Backtest
Calculator
Simple Seasonality
Calculator
The Kelly Criterion
Calculator
Sentiment Geo Map
‍
Public Research Reports
‍
Free Webinar
COMPANY
‍
About
‍
Meet our Team
‍
In the News
‍
Testimonials
‍
Client Success Stories
Pricing
Bundle pricing
‍
Announcements
‍
FAQ
© 2024 Sundial Capital Research Inc. All rights reserved.
Setsail Marketing
TermsPrivacyAffiliate Program
Risk Disclosure: Futures and forex trading contains substantial risk and is not for every investor. An investor could potentially lose all or more than the initial investment. Risk capital is money that can be lost without jeopardizing ones’ financial security or life style. Only risk capital should be used for trading and only those with sufficient risk capital should consider trading. Past performance is not necessarily indicative of future results.

Hypothetical Performance Disclosure: Hypothetical performance results have many inherent limitations, some of which are described below. No representation is being made that any account will or is likely to achieve profits or losses similar to those shown; in fact, there are frequently sharp differences between hypothetical performance results and the actual results subsequently achieved by any particular trading program. One of the limitations of hypothetical performance results is that they are generally prepared with the benefit of hindsight. In addition, hypothetical trading does not involve financial risk, and no hypothetical trading record can completely account for the impact of financial risk of actual trading. for example, the ability to withstand losses or to adhere to a particular trading program in spite of trading losses are material points which can also adversely affect actual trading results. There are numerous other factors related to the markets in general or to the implementation of any specific trading program which cannot be fully accounted for in the preparation of hypothetical performance results and all which can adversely affect trading results.

Testimonial Disclosure: Testimonials appearing on this website may not be representative of other clients or customers and is not a guarantee of future performance or success.