Data &
Technology
Research
Reports
Report Solutions
Reports Library
Actionable
Strategies
Free
Resources
Simple Backtest Calculator
Simple Seasonality Calculator
The Kelly Criterion Calculator
Sentiment Geo Map
Public Research Reports
Free Webinar
Pricing
Company
About
Meet Our Team
In the News
Testimonials
Client Success Stories
Contact
Log inLoginSign up
< BACK TO ALL REPORTS

Backtest Engine Scans I Have Known and Loved - The SPY % > 50-day MA Edition (Part I)

Jay Kaeppel
2021-06-09
This is Part II of a 3-part series this week highlighting useful Backtest Engine Scans. Please note that these scans are not necessarily presented on a "timely" basis. The goal is two-fold: 1.) To help you learn more about the Backtest Engine and its potentially powerful uses and 2.) To help you build an arsenal of scans that may ultimately prove to be very useful at just the right time

Sometimes the same indicator can be used in different ways. This is often due to the non-intuitive quirk of the stock markets that:

  • Deeply oversold can at times be bullish for stocks
  • Strongly overbought can ALSO at times be bullish for stocks

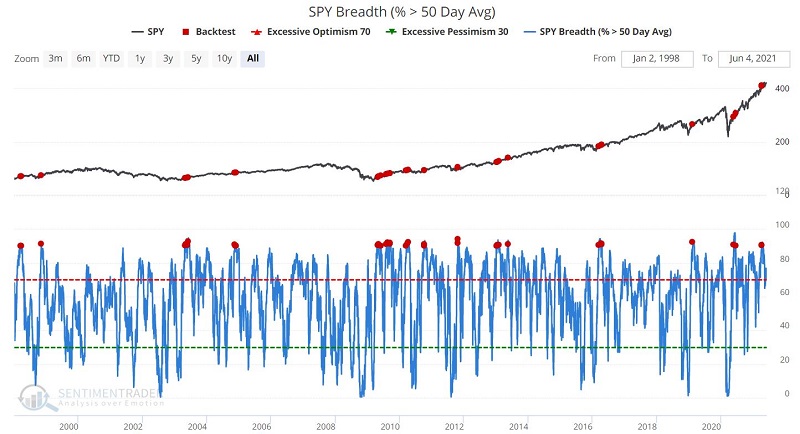
So, in this article and Part III, we will focus on two different ways to use the SPY % > 50-day MA indicator. As the name implies, this indicator measures the percentage of stocks held by SPY that are currently above their respective 50-day moving average. 

SPY % > 50-DAY MA

For our first test, we will attempt to use this measure as a momentum indicator. In this approach, we are NOT attempting to buy on weakness but rather buy into the type of strength that tends to follow through to the upside. In essence, we are looking for a continuation of a recent strong trend. While this type of momentum trading makes some traders nervous, applying an objective indicator to generate the signals can help to remove the emotion and increase one's confidence.

By clicking this link and then clicking "Run Backtest" you can run the following test:

  • We look at the SPY % > 50-day MA indicator 
  • We look for the indicator value to cross above 90 (i.e., 90%)

In plain English, we are looking for a day when at least 90% of the stocks held by ticker SPY are above their respective 50-day moving averages after NOT being above 90% the day before.

The chart below displays the signals.

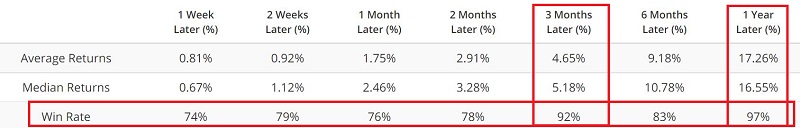
The figure below displays a summary of results 1 week to 1 year after each signal. The results are consistently favorable, though not perfect.

Note that:

  • Each time frame showed strong upward bias, with Win Rates ranging from 74% to 97%
  • 3 months had a Win Rate of 92% (good for traders)
  • 1-Year had a Win Rate of 97% (good for investors)
  • The 3-month Median return was 5.18%
  • The 1-year Median return was a robust +16.55%

Investors and traders are often hesitant to "chase the market" when it makes a strong up move. However, these signals offer a strong clue that it is time to "go with the flow."

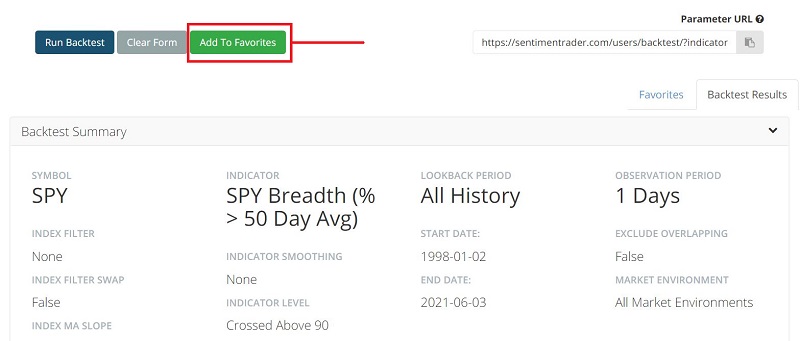
Now let's look at how you can save this scan (or any scan) so that you will automatically be alerted when it gives a signal.

You can do this by:

  • Clicking "Add to Favorites"

  • Typing "SPY % > 50-day MA crossed above 90"

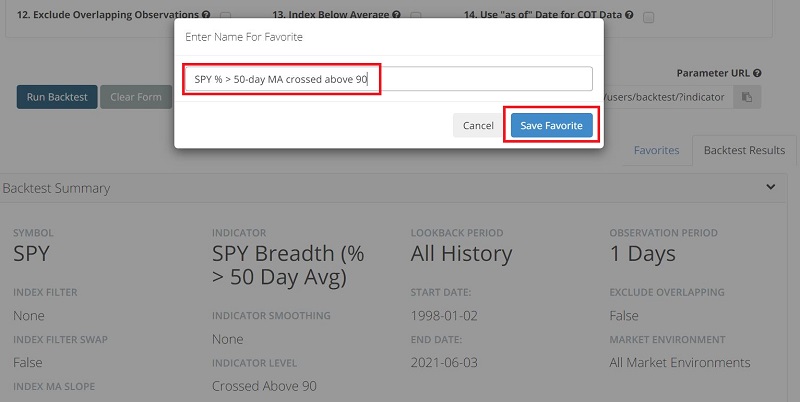
  • Then click "Save Favorite"

These steps will add this particular scan to your list of Favorites. Anytime you enter Backtest Engine, your Favorites will be listed at the bottom as per below.

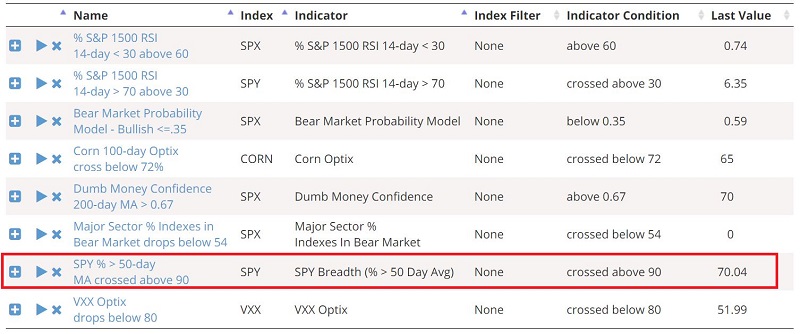
More importantly, any active Saved scan is listed at the bottom of your Evening Digest email. You can go to My Website Preferences under My Account to make sure you get those (they are on by default).

Sorry, you don't have access to this report

Upgrade your subscription plan to get access
Go to Dasboard
DATA &
TECHnologies
IndicatorEdge
‍
BackTestEdge
‍
Other Tools
‍
DataEdge API
RESEARCH
reports
Research Solution
‍
Reports Library
‍
actionable
Strategies
Trading Strategies
‍
Smart Stock Scanner
‍
FREE
RESOUrCES
Simple Backtest
Calculator
Simple Seasonality
Calculator
The Kelly Criterion
Calculator
Sentiment Geo Map
‍
Public Research Reports
‍
Free Webinar
COMPANY
‍
About
‍
Meet our Team
‍
In the News
‍
Testimonials
‍
Client Success Stories
Pricing
Bundle pricing
‍
Announcements
‍
FAQ
© 2024 Sundial Capital Research Inc. All rights reserved.
Setsail Marketing
TermsPrivacyAffiliate Program
Risk Disclosure: Futures and forex trading contains substantial risk and is not for every investor. An investor could potentially lose all or more than the initial investment. Risk capital is money that can be lost without jeopardizing ones’ financial security or life style. Only risk capital should be used for trading and only those with sufficient risk capital should consider trading. Past performance is not necessarily indicative of future results.

Hypothetical Performance Disclosure: Hypothetical performance results have many inherent limitations, some of which are described below. No representation is being made that any account will or is likely to achieve profits or losses similar to those shown; in fact, there are frequently sharp differences between hypothetical performance results and the actual results subsequently achieved by any particular trading program. One of the limitations of hypothetical performance results is that they are generally prepared with the benefit of hindsight. In addition, hypothetical trading does not involve financial risk, and no hypothetical trading record can completely account for the impact of financial risk of actual trading. for example, the ability to withstand losses or to adhere to a particular trading program in spite of trading losses are material points which can also adversely affect actual trading results. There are numerous other factors related to the markets in general or to the implementation of any specific trading program which cannot be fully accounted for in the preparation of hypothetical performance results and all which can adversely affect trading results.

Testimonial Disclosure: Testimonials appearing on this website may not be representative of other clients or customers and is not a guarantee of future performance or success.