
Backtest Engine Scans I Have Known and Loved - The Copper/Gold Ratio Edition

Our mission at Sentimentrader is essentially to do as much of the work as possible for you in terms of delineating what actually works from what people "think" (or, in some cases, "hope") actually works. But there are a few key points to keep in mind:
- Absolutely nothing works all of the time
- Not every piece of information is intended to generate an automatic buy or sell signal (many things are useful as "weight of the evidence")
- There are useful relationships in the markets that few investors are aware of
- Regardless of what the data says, real-world trading success still involves how you allocate capital (money management) and how you manage risk on each trade (risk management)
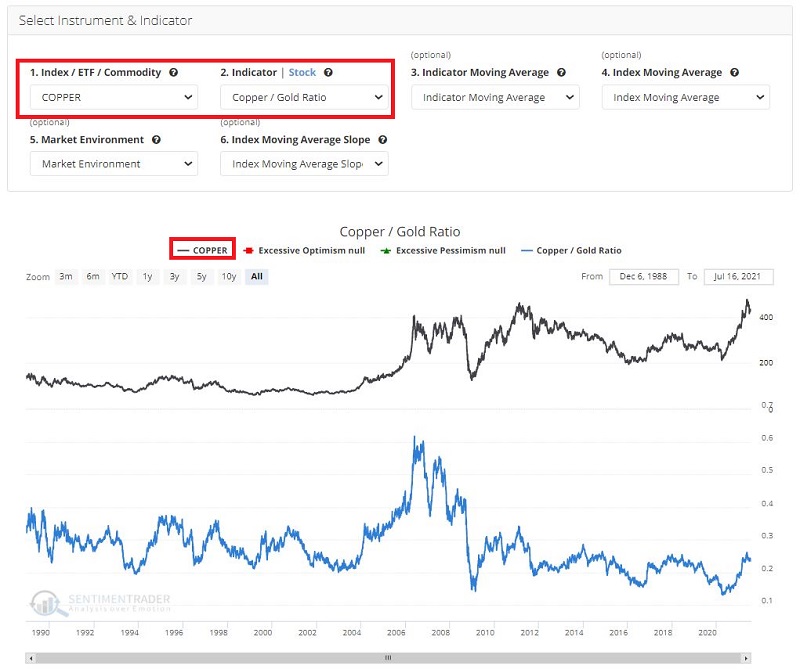
This piece will focus on the Copper/Gold ratio and how this ratio can be used in various markets. As the name implies, this ratio tracks the price of copper divided by the price of gold. For our purposes, we use the continuous futures contract from copper and the continuous futures contract for gold, provided by Bloomberg. As we will see in a moment, this ratio can fluctuate a great deal.
COPPER VS. COPPER/GOLD RATIO
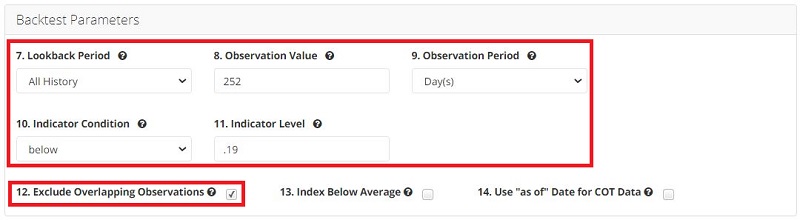
For our first test, we will look at the performance for copper following days when the Copper/Gold Ratio:
- Drops below 0.19
- For the first time in 252 trading days
The inputs for this test in the Backtest Engine appear in the screenshots below. You can access this test directly by clicking here.
The output appears in the screenshots below.
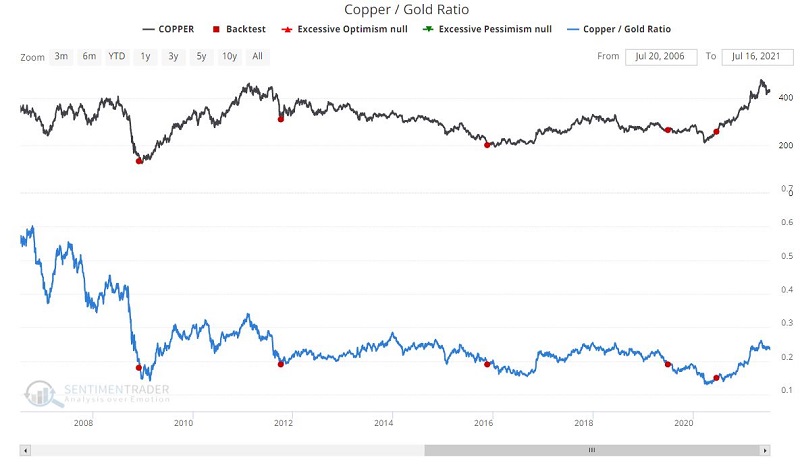
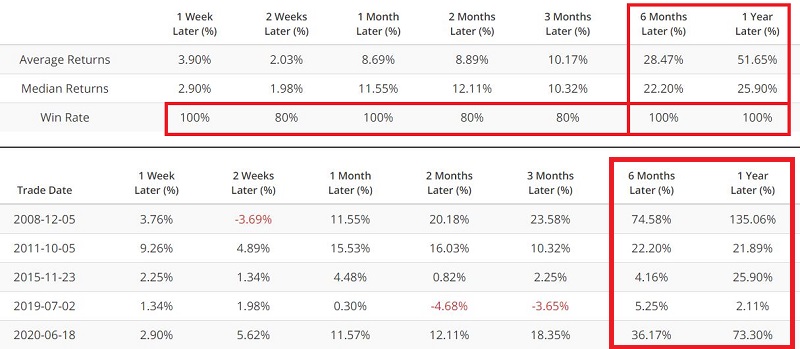
Note that there have been only a small number of signals and have all occurred within the last 15 years. This does raise the issues of small sample size and possible curve-fitting. One suggestion I would make is to use this information the way I do: as "weight of the evidence" and NOT as an automatic "Buy" signal.
NOTE: You can save this scan to your Favorites by clicking "Add to Favorites" and typing in a name for the test (i.e., ex., "Copper vs. Copper/Gold Ratio crossed below 0.19" and clicking "Save to Favorites."
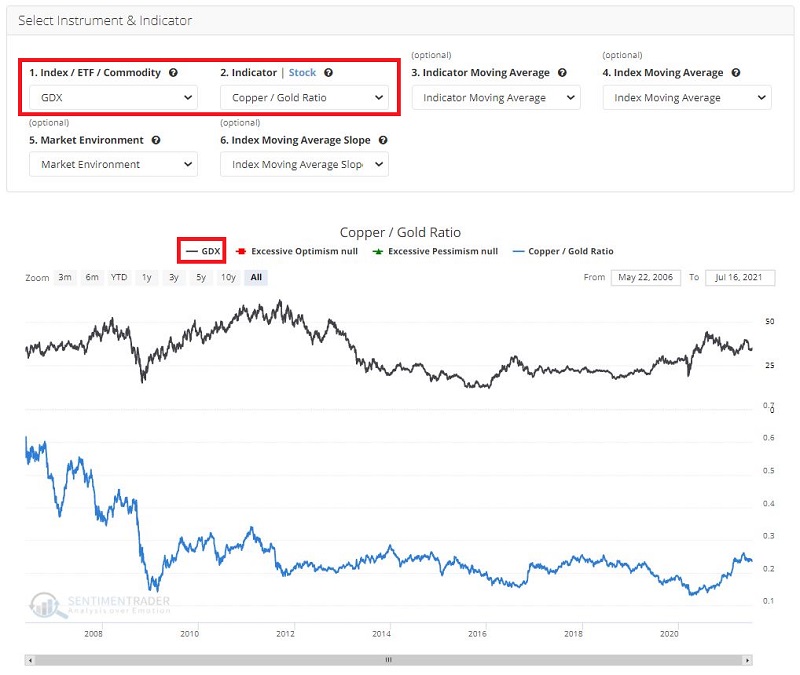
GDX VS. COPPER/GOLD RATIO
For our first test, we will look at the performance for ticker GDX (VanEck Vectors Gold Miners ETF ) following days when the Copper/Gold Ratio:
- Drops below 0.19
- For the first time in 252 trading days
The inputs for this test in the Backtest Engine appear in the screenshots below. You can access this test directly by clicking here.
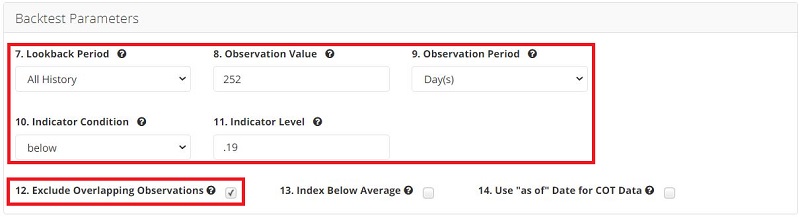
The output appears in the screenshots below.
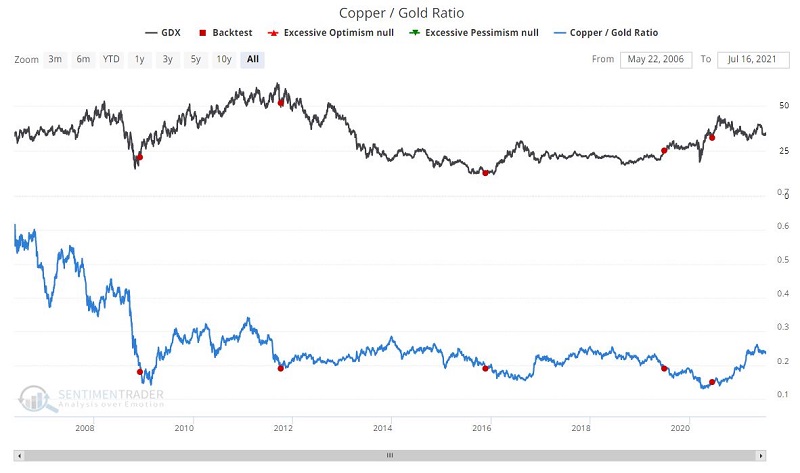
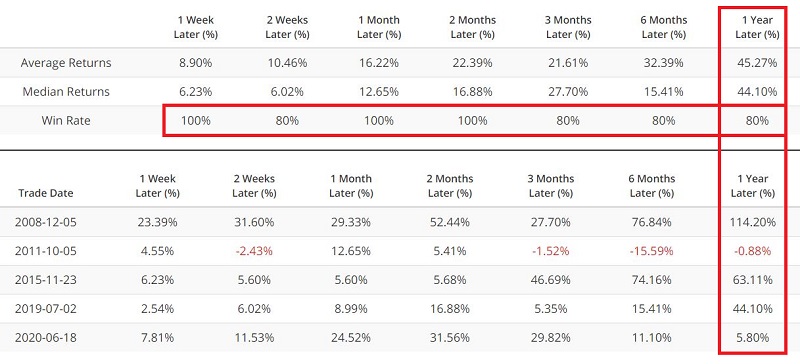
Once again, a small sample size but some noteworthy results.
NOTE: You can save this scan to your Favorites by clicking "Add to Favorites" and typing in a name for the test (i.e., ex., "GDX vs. Copper/Gold Ratio crossed below 0.19" and clicking "Save to Favorites."
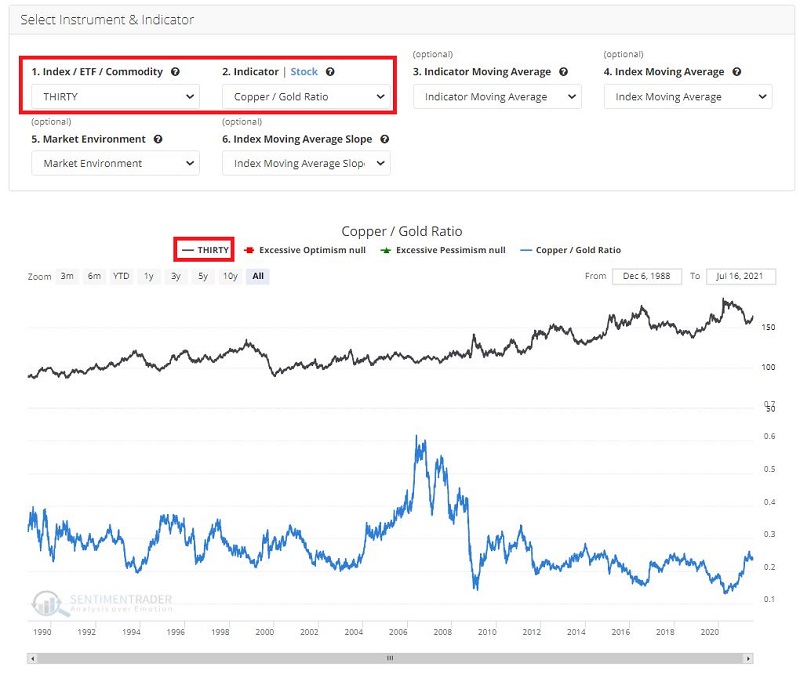
30-YEAR TREASURIES VS. COPPER/GOLD RATIO
I mentioned earlier that there are useful relationships in the markets that few investors are aware of AND that not every piece of information is intended to be used as a specific buy/sell signal. This next one is a case in point.
Interest rates topped out in the early 1980s and have been trending lower ever since. As a result, 30-year treasuries have mostly been in a bull market for the past four decades. It is, therefore, interesting to note that long-term treasuries have generally performed poorly when the Copper/Gold Ratio is below 0.20.
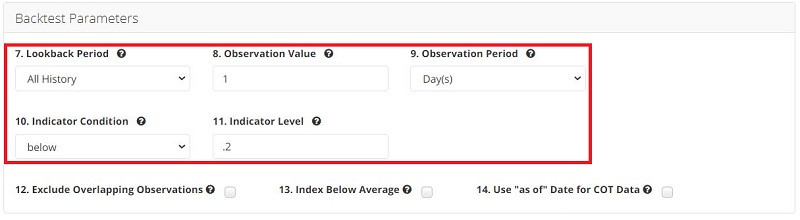
For our first test, we will look at the performance for 30-year treasuries following days when the Copper/Gold Ratio:
- is below 0.20
The inputs for this test in the Backtest Engine appear in the screenshots below. You can access this test directly by clicking here.
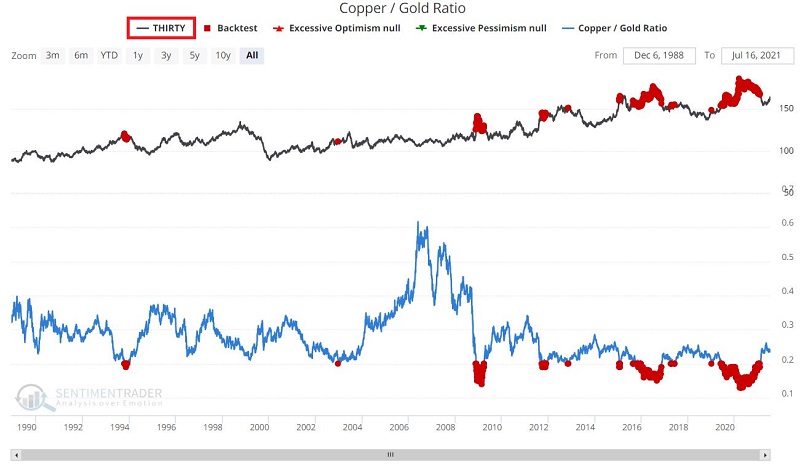
The output appears in the screenshots below.
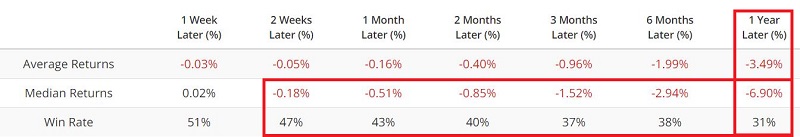
As a point of comparison, note that since 1977, the 30-year treasury has shown:
- A 1-Year gain 58% of the time
- A median 1-Year % return of +1.99%
While results are not uniformly bearish, the Average Returns, Median Returns and Win Rate are significantly below the long-term average across all time frames. As a result, bond traders may be wise to be cautious when the Copper/Gold Ratio drops below 0.20.
NOTE: You can save this scan to your Favorites by clicking "Add to Favorites" and typing in a name for the test (i.e., ex., "THIRTY vs. Copper/Gold Ratio below 0.20" and clicking "Save to Favorites."