Data &
Technology
Research
Reports
Report Solutions
Reports Library
Actionable
Strategies
Free
Resources
Simple Backtest Calculator
Simple Seasonality Calculator
The Kelly Criterion Calculator
Sentiment Geo Map
Public Research Reports
Free Webinar
Pricing
Company
About
Meet Our Team
In the News
Testimonials
Client Success Stories
Contact
Log inLoginSign up
< BACK TO ALL REPORTS

Attention Shoppers!

Jay Kaeppel
2021-02-25
Since roughly the mid-1970's, certain months of the year have typically been much more favorable for Consumer Discretionary stocks than others. Let's take a closer look.

Since roughly the mid-1970's, certain months of the year have typically been much more favorable for Consumer Discretionary stocks than others. Let's take a closer look.

For testing purposes, we will use the S&P 500 Consumer Discretionary Index (heretofore referred to as SCDI). We will look at the month total return performance for SCDI during:

  • March, April, May, November and December
  • versus all other months
  • From January 1977 through December 2020

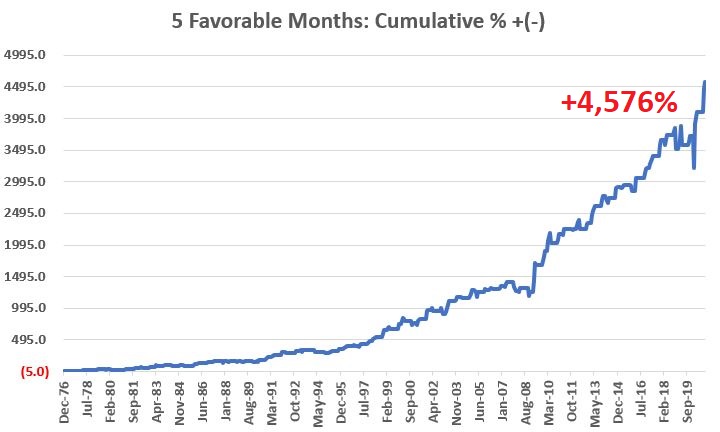
The chart below displays the cumulative total return for SCDI ONLY during the 5 "favorable" months

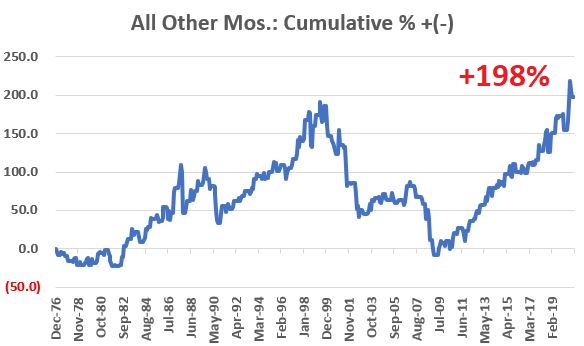
The chart below displays the cumulative total return for SCDI ONLY during "all other months"

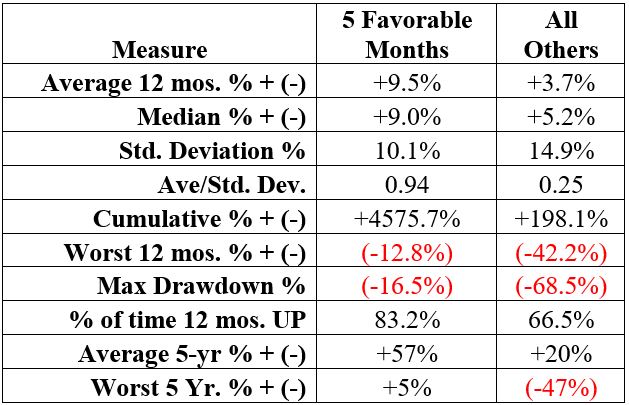
The relevant comparative numbers appear below.

It would be incorrect to refer to "All Other Months" as "bearish". As you can see in the second chart above SCDI performed very well during these months during stretches of the 80's, 90's and since the low in 2009. But what we are really comparing here is:

  • Cumulative results
  • Relative consistency

The question we are looking to answer is "when is the best time to allocate capital to the consumer discretionary sector. The data appears to answer that question. To wit:

  • The 5 Favorable Months showed a gain 23 times that of All Other Months (+4,576% vs. +198%)
  • The 5 Favorable Months had a significantly lower standard deviation of returns (10.1% vs. 14.9%)
  • The worst drawdown during the 5 Favorable months was a manageable -16.5% (versus -68.5%)
  • The 5 Favorable Months showed a 12-month gain 83% of the time
  • The worst 5-year performance for the 5 Favorable Months was a gain of +5% (versus -47%)

Can we say with certainty that these 5 months will continue to see better performance ad infinitum into the future? Not necessarily. Still, investing is a lot about finding an "edge" and exploiting it as often as possible and for as long as possible. 

For investors, ticker XLY (Consumer Discretionary Select Sector SPDR Fund) tracks the index used in the test with a correlation of roughly 0.998. Another alternative is ticker FSRPX (Fidelity Select Retailing Portfolio) which tracks the index with a correlation of roughly 0.94.

Sorry, you don't have access to this report

Upgrade your subscription plan to get access
Go to Dasboard
DATA &
TECHnologies
IndicatorEdge
‍
BackTestEdge
‍
Other Tools
‍
DataEdge API
RESEARCH
reports
Research Solution
‍
Reports Library
‍
actionable
Strategies
Trading Strategies
‍
Smart Stock Scanner
‍
FREE
RESOUrCES
Simple Backtest
Calculator
Simple Seasonality
Calculator
The Kelly Criterion
Calculator
Sentiment Geo Map
‍
Public Research Reports
‍
Free Webinar
COMPANY
‍
About
‍
Meet our Team
‍
In the News
‍
Testimonials
‍
Client Success Stories
Pricing
Bundle pricing
‍
Announcements
‍
FAQ
© 2024 Sundial Capital Research Inc. All rights reserved.
Setsail Marketing
TermsPrivacyAffiliate Program
Risk Disclosure: Futures and forex trading contains substantial risk and is not for every investor. An investor could potentially lose all or more than the initial investment. Risk capital is money that can be lost without jeopardizing ones’ financial security or life style. Only risk capital should be used for trading and only those with sufficient risk capital should consider trading. Past performance is not necessarily indicative of future results.

Hypothetical Performance Disclosure: Hypothetical performance results have many inherent limitations, some of which are described below. No representation is being made that any account will or is likely to achieve profits or losses similar to those shown; in fact, there are frequently sharp differences between hypothetical performance results and the actual results subsequently achieved by any particular trading program. One of the limitations of hypothetical performance results is that they are generally prepared with the benefit of hindsight. In addition, hypothetical trading does not involve financial risk, and no hypothetical trading record can completely account for the impact of financial risk of actual trading. for example, the ability to withstand losses or to adhere to a particular trading program in spite of trading losses are material points which can also adversely affect actual trading results. There are numerous other factors related to the markets in general or to the implementation of any specific trading program which cannot be fully accounted for in the preparation of hypothetical performance results and all which can adversely affect trading results.

Testimonial Disclosure: Testimonials appearing on this website may not be representative of other clients or customers and is not a guarantee of future performance or success.