Data &
Technology
Research
Reports
Report Solutions
Reports Library
Actionable
Strategies
Free
Resources
Simple Backtest Calculator
Simple Seasonality Calculator
The Kelly Criterion Calculator
Sentiment Geo Map
Public Research Reports
Free Webinar
Pricing
Company
About
Meet Our Team
In the News
Testimonials
Client Success Stories
Contact
Log inLoginSign up
< BACK TO ALL REPORTS

Attention Shoppers - Beware a Potential Markdown

Jay Kaeppel
2021-09-17
Like many sectors, the retail/consumer discretionary sector has enjoyed significant gains since the Covid-panic low in early 2020. At the same time, ticker XRT is presently unchanged from its price in late January 2021. And the Annual Seasonal Trend suggests a period of seasonal weakness directly ahead. In this piece, we highlight the details.

Attention Shoppers.  History suggests a 50/50 chance that the prices of your favorite retail and/or consumer discretionary stocks could be marked down soon.

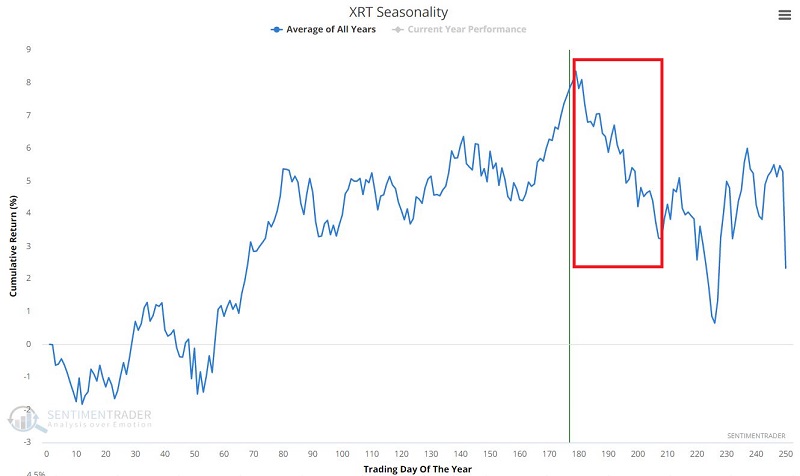
To wit, the chart below displays the Annual Seasonal Trend for ticker XRT (SPDR S&P Retail ETF). As you can see, we are entering a seasonally weak period.


RETAIL/CONSUMER DISCRETION SEASONAL WEAKNESS

For testing, we will use the S&P 500 Discretionary Index (which contains many retailing-related stocks and has a high correlation to ticker XRT), going back to 1953.

Let's focus on the period extending from:

  • The close on Trading Day of the Year #179
  • Through the close of Trading Day of the Year #208

The chart below displays the year-by-year % return for the index during this period
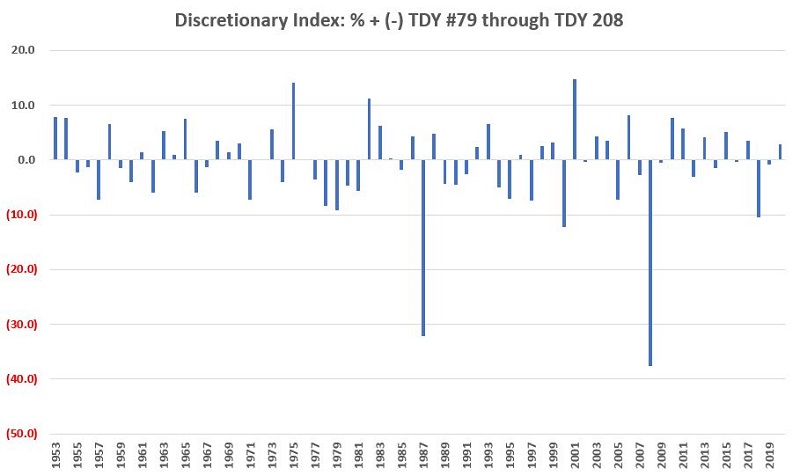
Things to note:

  • # of Times UP = 34
  • # of Times Down = 34
  • Average UP % = +4.9%
  • Average DOWN % = (-6.3%)

The bottom line is that whether this period shows a gain or loss is essentially a coin-flip (50% up, 50% down) on a year-to-year basis. However, the average losing period is worse than the average winning period. This explains the results in the chart below, which displays the cumulative % + (-) for the discretionary index during this "unfavorable" period.

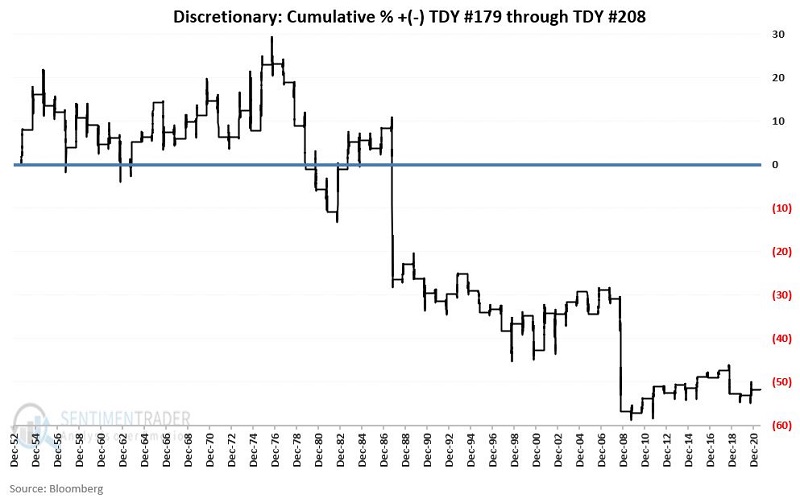
The cumulative return for the discretionary index held ONLY from TDY 179 through TDY #208 every year since 1953 is -52%.

To put this into context, the chart below displays:

  • A logarithmic chart
  • The growth of $1 invested in the discretionary index if held during ALL OTHER DAYS of the year (i.e., excluding TDY 179 through TDY #208).

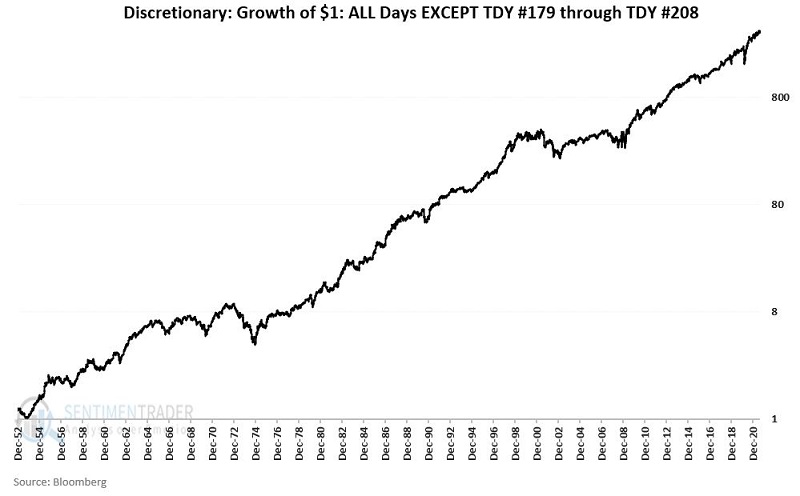
From January 1, 1953, through August 31st, 2021, the cumulative total return during these days was +160,300%.

SUMMARY

So far in 2021, the stock market has shrugged off all suggestions of anything that might be unfavorable for stocks.  Will this run continue, or will the market's luck run out.  As far as the retailing/consumer discretionary sectors go, history suggests the odds are 50/50 and that investors should be prepared for anything in the weeks directly ahead.

Sorry, you don't have access to this report

Upgrade your subscription plan to get access
Go to Dasboard
DATA &
TECHnologies
IndicatorEdge
‍
BackTestEdge
‍
Other Tools
‍
DataEdge API
RESEARCH
reports
Research Solution
‍
Reports Library
‍
actionable
Strategies
Trading Strategies
‍
Smart Stock Scanner
‍
FREE
RESOUrCES
Simple Backtest
Calculator
Simple Seasonality
Calculator
The Kelly Criterion
Calculator
Sentiment Geo Map
‍
Public Research Reports
‍
Free Webinar
COMPANY
‍
About
‍
Meet our Team
‍
In the News
‍
Testimonials
‍
Client Success Stories
Pricing
Bundle pricing
‍
Announcements
‍
FAQ
© 2024 Sundial Capital Research Inc. All rights reserved.
Setsail Marketing
TermsPrivacyAffiliate Program
Risk Disclosure: Futures and forex trading contains substantial risk and is not for every investor. An investor could potentially lose all or more than the initial investment. Risk capital is money that can be lost without jeopardizing ones’ financial security or life style. Only risk capital should be used for trading and only those with sufficient risk capital should consider trading. Past performance is not necessarily indicative of future results.

Hypothetical Performance Disclosure: Hypothetical performance results have many inherent limitations, some of which are described below. No representation is being made that any account will or is likely to achieve profits or losses similar to those shown; in fact, there are frequently sharp differences between hypothetical performance results and the actual results subsequently achieved by any particular trading program. One of the limitations of hypothetical performance results is that they are generally prepared with the benefit of hindsight. In addition, hypothetical trading does not involve financial risk, and no hypothetical trading record can completely account for the impact of financial risk of actual trading. for example, the ability to withstand losses or to adhere to a particular trading program in spite of trading losses are material points which can also adversely affect actual trading results. There are numerous other factors related to the markets in general or to the implementation of any specific trading program which cannot be fully accounted for in the preparation of hypothetical performance results and all which can adversely affect trading results.

Testimonial Disclosure: Testimonials appearing on this website may not be representative of other clients or customers and is not a guarantee of future performance or success.