Data &
Technology
Research
Reports
Report Solutions
Reports Library
Actionable
Strategies
Free
Resources
Simple Backtest Calculator
Simple Seasonality Calculator
The Kelly Criterion Calculator
Sentiment Geo Map
Public Research Reports
Free Webinar
Pricing
Company
About
Meet Our Team
In the News
Testimonials
Client Success Stories
Contact
Log inLoginSign up
< BACK TO ALL REPORTS

As tech indexes rally, participation starts to wane

Jason Goepfert
2020-07-09
Most major technology stock indexes have been hitting new highs in recent days. A small warning is popping up in the percentage of members of these indexes that are holding above their 50-day averages, which has been declining over the past month. This kind of divergence has preceded some rocky markets for tech over the next 1-3 months.

Finding fault with the rally in tech has been difficult, as it has powered higher with decent participation (shorter-term, anyway). About the only warning signs have come from "too far, too fast" types of measures, and even those haven't been consistent warning signs.

As pointed out on Twitter, though, there are some emerging signs that participation among these stocks is lagging. We saw on Wednesday that when looking at an equal-weight index of the largest tech stocks, their relative performance just hit a new low.

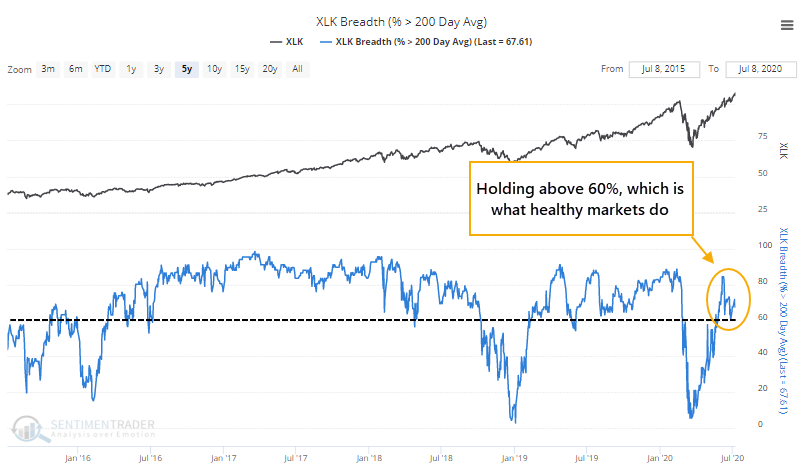
On the plus side, while the broader market continues to show signs of being unhealthy longer-term, that's not evident in tech. More than 60% of these stocks are holding above their long-term 200-day moving averages, which is what we see during healthy market environments.

The potential trouble is over the medium-term. Despite new highs virtually every day in funds like XLK, the percentage of members in the tech sector that are holding above their 50-day averages is dropping and is well of the highs.

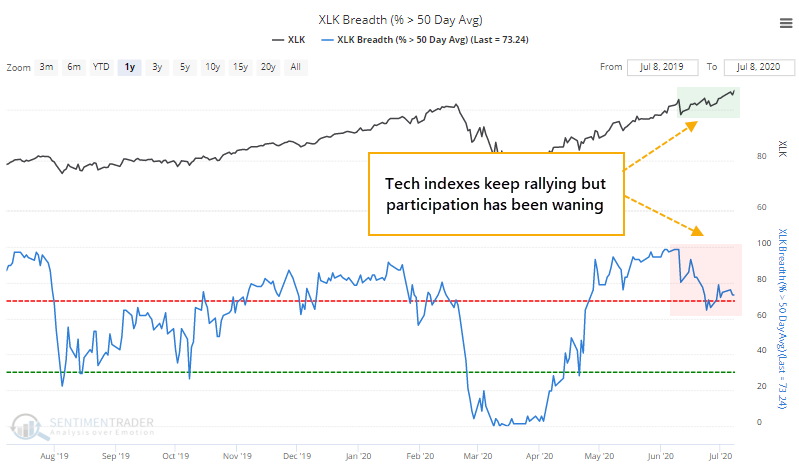
More than 95% of tech stocks were above their 50-day averages a month ago, and now fewer than 75% of them are.

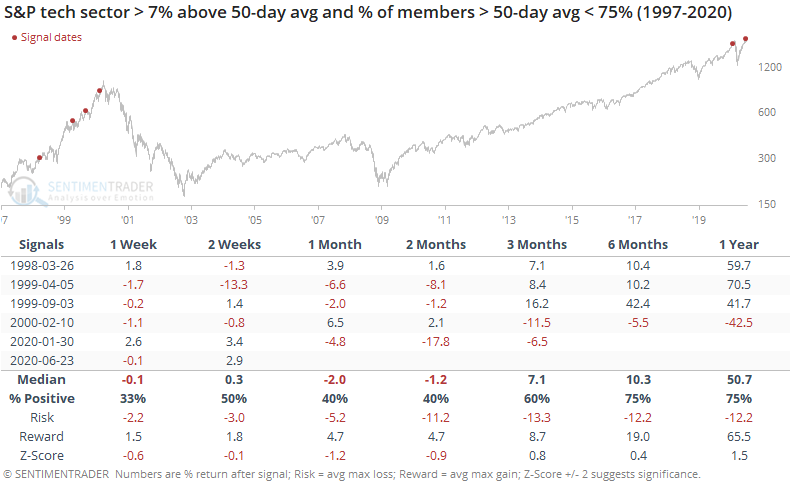
When the tech sector hit a 52-week high and the percentage of its members above their 50-day average was more than 20% below the peak, we can see what happened going forward in the table below.

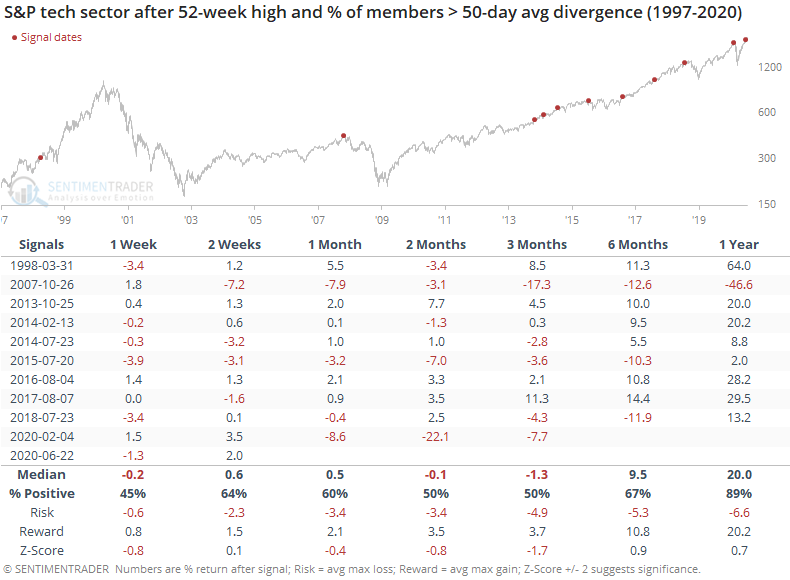
This was an effective warning sign at a few peaks (2007, 2015, 2018, 2020), which would have saved us from pretty drastic declines in the months ahead. Unfortunately, it also failed as a warning multiple times. About the worst we can say is that 7 out of the 10 signals showed a negative return in tech stocks somewhere between 1 - 3 months later.

The percentage of members above their 50-day average has been dropping for a while, and the 10-day average of this indicator has hit a 30-day low. Again, this kind of divergence has preceded some troubles over the next couple of months.

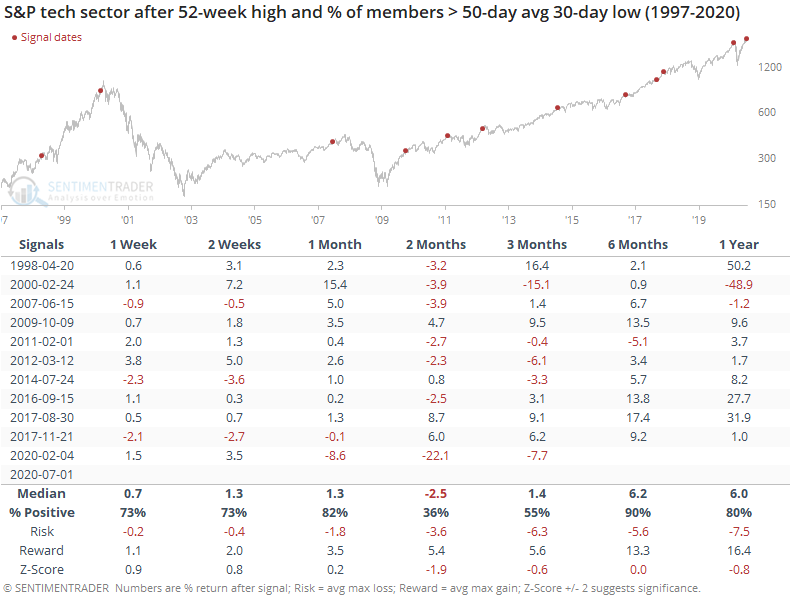
It's also notable that tech stock indexes are nearly 10% above their 50-day averages, and yet fewer than 75% of members are above their own averages by any amount. This kind of stark difference was rare, only triggering during the lead-up to the bubble peak, and again in January of this year.

There is certainly a chance that tech can shrug off this potential warning in the weeks ahead. Maybe participation will turn around and further fuel the rally. Historically, that has not happened, and the major tech indexes have dropped in order to catch up with the declining participation of the stocks. We'd consider this a minor warning here.

Sorry, you don't have access to this report

Upgrade your subscription plan to get access
Go to Dasboard
DATA &
TECHnologies
IndicatorEdge
‍
BackTestEdge
‍
Other Tools
‍
DataEdge API
RESEARCH
reports
Research Solution
‍
Reports Library
‍
actionable
Strategies
Trading Strategies
‍
Smart Stock Scanner
‍
FREE
RESOUrCES
Simple Backtest
Calculator
Simple Seasonality
Calculator
The Kelly Criterion
Calculator
Sentiment Geo Map
‍
Public Research Reports
‍
Free Webinar
COMPANY
‍
About
‍
Meet our Team
‍
In the News
‍
Testimonials
‍
Client Success Stories
Pricing
Bundle pricing
‍
Announcements
‍
FAQ
© 2024 Sundial Capital Research Inc. All rights reserved.
Setsail Marketing
TermsPrivacyAffiliate Program
Risk Disclosure: Futures and forex trading contains substantial risk and is not for every investor. An investor could potentially lose all or more than the initial investment. Risk capital is money that can be lost without jeopardizing ones’ financial security or life style. Only risk capital should be used for trading and only those with sufficient risk capital should consider trading. Past performance is not necessarily indicative of future results.

Hypothetical Performance Disclosure: Hypothetical performance results have many inherent limitations, some of which are described below. No representation is being made that any account will or is likely to achieve profits or losses similar to those shown; in fact, there are frequently sharp differences between hypothetical performance results and the actual results subsequently achieved by any particular trading program. One of the limitations of hypothetical performance results is that they are generally prepared with the benefit of hindsight. In addition, hypothetical trading does not involve financial risk, and no hypothetical trading record can completely account for the impact of financial risk of actual trading. for example, the ability to withstand losses or to adhere to a particular trading program in spite of trading losses are material points which can also adversely affect actual trading results. There are numerous other factors related to the markets in general or to the implementation of any specific trading program which cannot be fully accounted for in the preparation of hypothetical performance results and all which can adversely affect trading results.

Testimonial Disclosure: Testimonials appearing on this website may not be representative of other clients or customers and is not a guarantee of future performance or success.