
As small stocks (almost) double, optimism peaks

Last week, we saw that as some signs of "smart money" selling were triggering, options speculation was hitting records again.
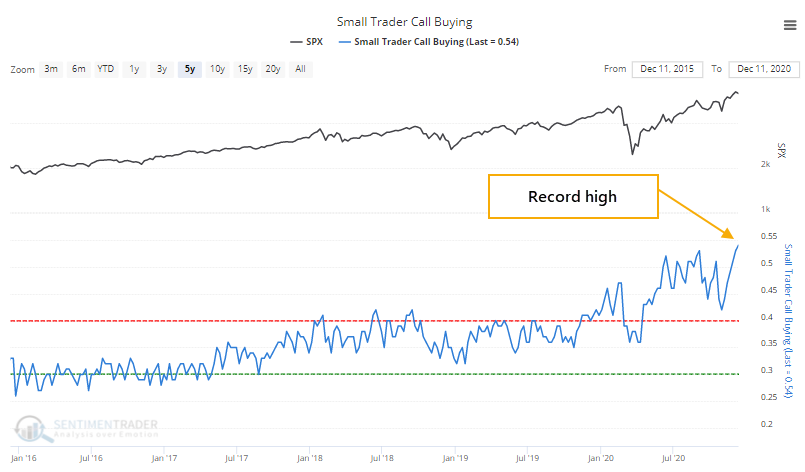
Choppy conditions over the past week didn't seem to dent that behavior at all. Among the smallest of traders, 54% of volume flowed into buying call options to open. That's a record amount of focus among the most speculative of strategies and among the most speculative of traders.
The 5-year chart above shows just how much this behavior has ticked up. It was extreme in January and February, which was a big worry at the time. The pandemic made these traders retreat to a neutral position at worst, then it moved to new records by June. Surely, there are many reasons why this is happening, but that doesn't make it any less worrisome now that we're seeing another batch of record speculation.
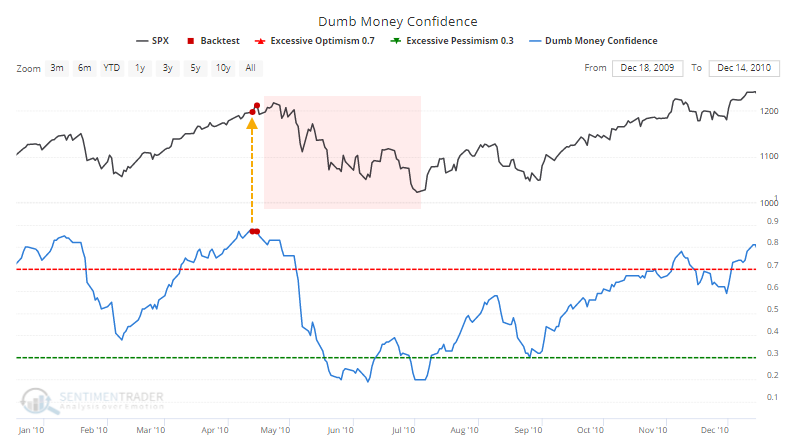
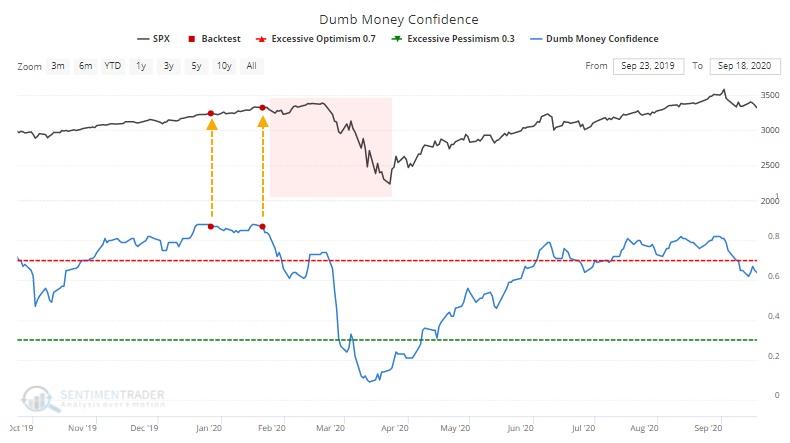
Even with this ever-higher speculative activity in the options market, Dumb Money Confidence pulled back a bit last week from a level we hadn't seen since starting this model in 1998. It has since dropped below 87%, which the Backtest Engine shows has happened only a few times before.
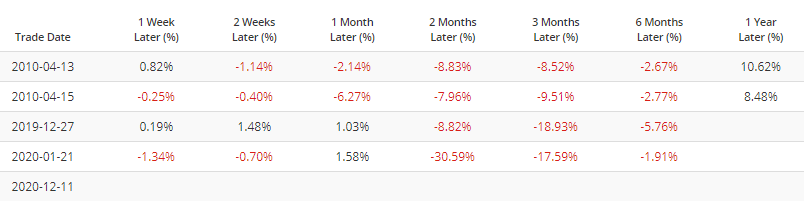
In April 2010, it preceded an almost immediate correction.
At the end of 2019, it was an initial fakeout as stocks soon recovered to new highs, then the pandemic hit.
It's hard to blame folks for getting so positive. After being left behind, smaller stocks have surged in recent months, and that contributed to impressive, even historic, positive breadth readings. There's nothing negative to say about that - as we've seen in past studies, that kind of behavior has a strong tendency to lead to positive 6-12 month returns.
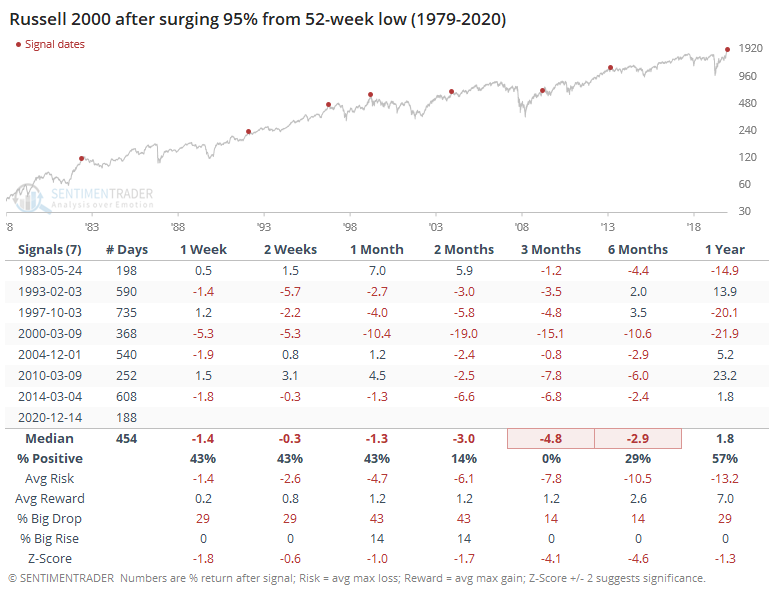
About the only cautionary signal is just how stretched prices have become. At its high today, the Russell 2000 almost doubled from its most recent 52-week low. Even a surge of 95% off a low has preceded losses in the small-cap index over the next 3 months every time.
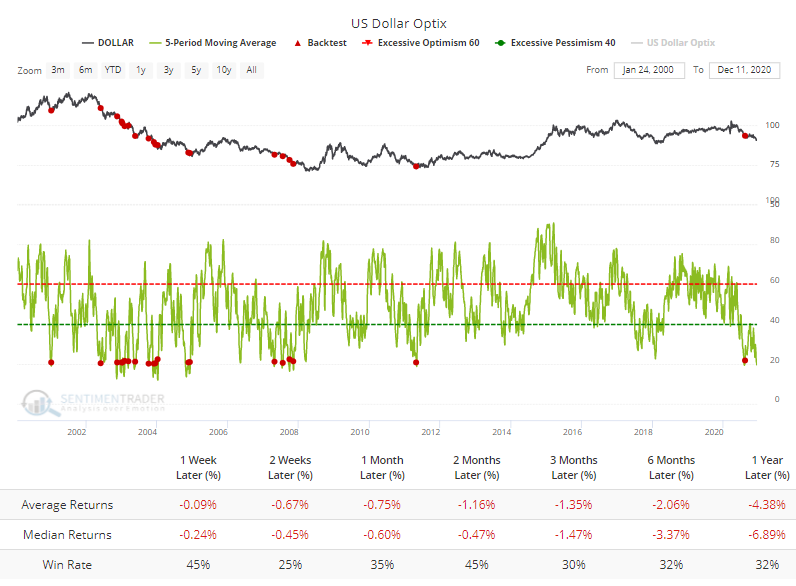
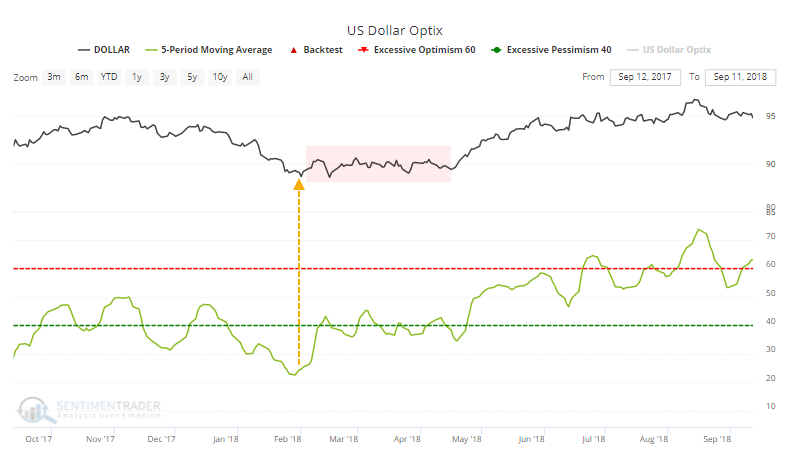
At the same time that sentiment is ebbing from record levels in stocks, it's trying to recover in the dollar. The Optimism Index for the buck is only now trying to curl up from an extremely low level.
As we discussed previously, though, extreme pessimism in the dollar has not been a consistently good reason to expect it to turn, with consistently poor returns after other times the 5-day Optix curled higher from below 20.
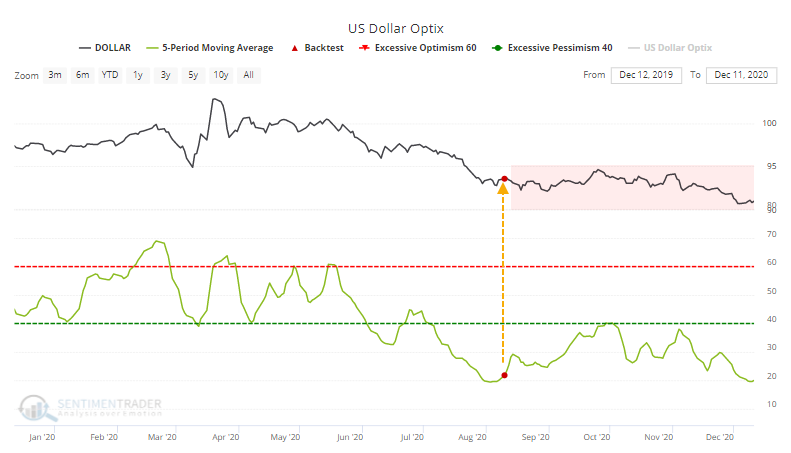
When it happened earlier this summer, it turned tail almost immediately and resumed its slide.
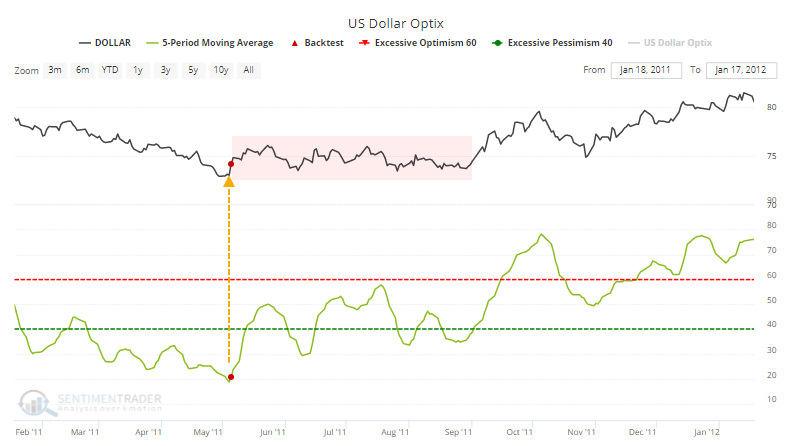
Almost the same thing happened the only other time in the past decade when the Optix curled higher from under 20.
In early 2018, it almost got this low before sentiment turned, but again it preceded months of chop with a downside bias for the dollar finally managed to string together some consistent gains.
The reason this might be notable now is because there has been a negative correlation between daily changes in the S&P 500 and the dollar.
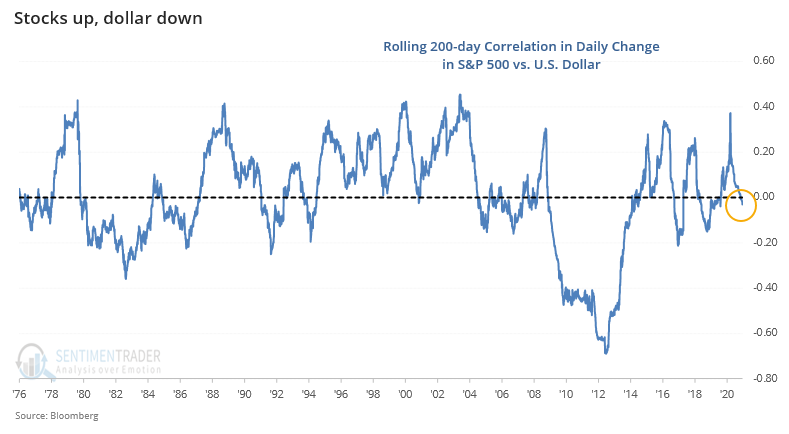
Intermarket correlations are a tricky thing and change all the time. Given the current pattern, however, if the dollar did manage to rally from this bout of extreme pessimism, then it could be a modest headwind for stocks.
Overall, not much has changed in recent weeks. We're seeing pockets of high, even record optimism, with a 15-year high in the percentage of our indicators that are showing extreme optimism. That is triggering during a period which has seen extremely impressive momentum, which is not always the case when optimism is high. Under similar conditions, stocks can gravitate for weeks or even months more, but almost always give back those gains during a subsequent pullback. When stocks start to wobble, with an increased daily range, and if/when short-term trend-following measures turn negative, we typically see months of digestion as stocks pull back at least 3%-8%.