Data &
Technology
Research
Reports
Report Solutions
Reports Library
Actionable
Strategies
Free
Resources
Simple Backtest Calculator
Simple Seasonality Calculator
The Kelly Criterion Calculator
Sentiment Geo Map
Public Research Reports
Free Webinar
Pricing
Company
About
Meet Our Team
In the News
Testimonials
Client Success Stories
Contact
Log inLoginSign up
< BACK TO ALL REPORTS

As Nasdaq indexes rallied, oddities have risen

Jason Goepfert
2020-07-14
Even as the Nasdaq 100 (and broader Nasdaq) rallied to record highs, options traders have been pricing in higher volatility going forward, so there has been a positive correlation between the NDX and VXN. Breadth momentum has slowed, too, so the McClellan Oscillator was negative. Combined with Monday's price reversal, it suggests caution.

At the end of 2016, we looked at what had become yet another odd market development. Stocks were rising, and so was the VIX "fear gauge." That is based on options traders' anticipation of future volatility, and in the stock market, volatility = lower prices with a high degree of consistency.

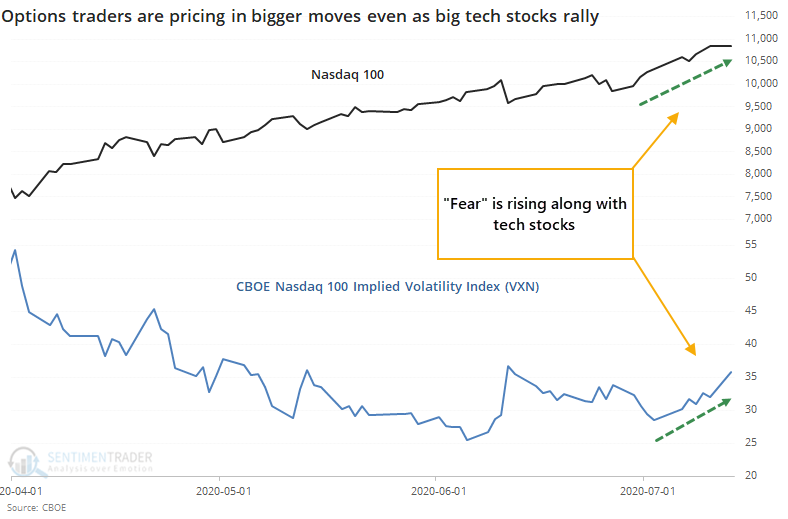
We entered a historic momentum market soon after that, which rolled over the slight negative implications of the S&P's positive correlation to the VIX. Maybe we're on the cusp of the same thing now, as Jesse Felder notes that it's happening in tech stocks.

The Nasdaq 100 (NDX) is hitting new highs, but options traders are pricing in more volatility as we enter earnings season, with the NDX's version of the "fear gauge" (the VXN) rising in recent days. Entering Monday afternoon, the NDX was up more than 1%, and the VXN was up by more than 8%. That had never happened before.

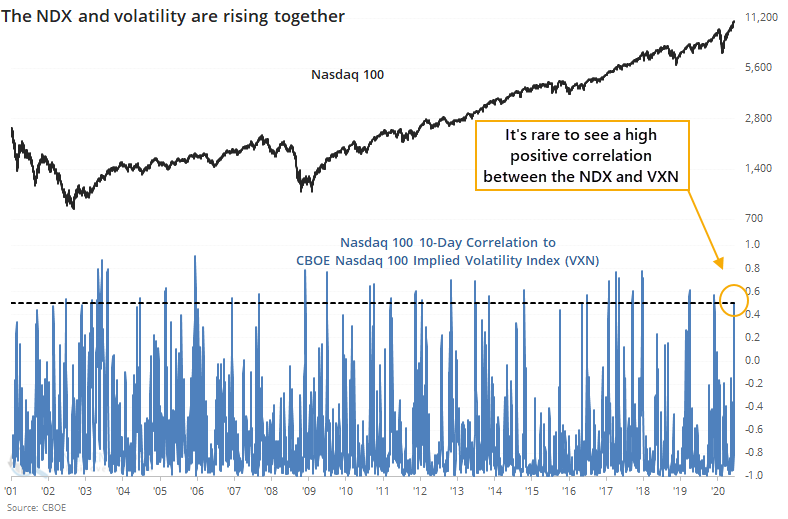
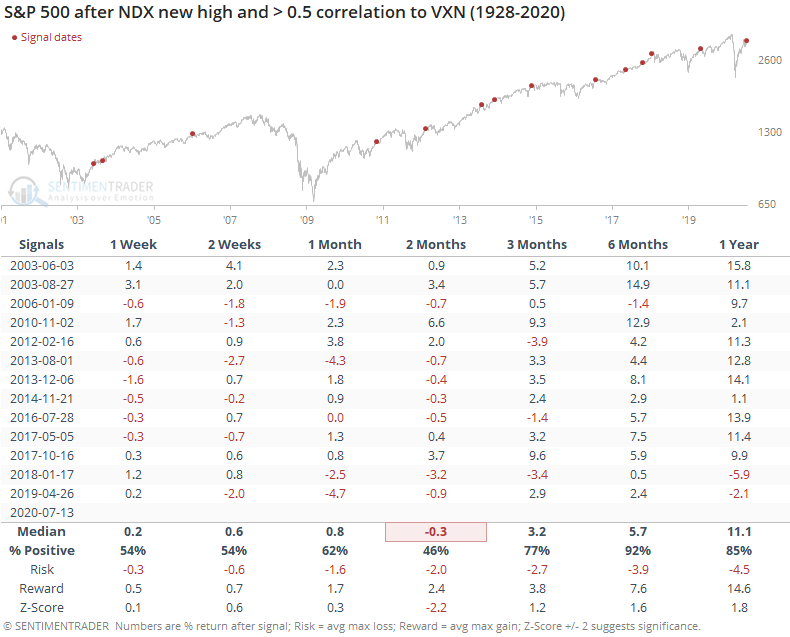
This behavior has pushed the correlation between them well into positive territory.

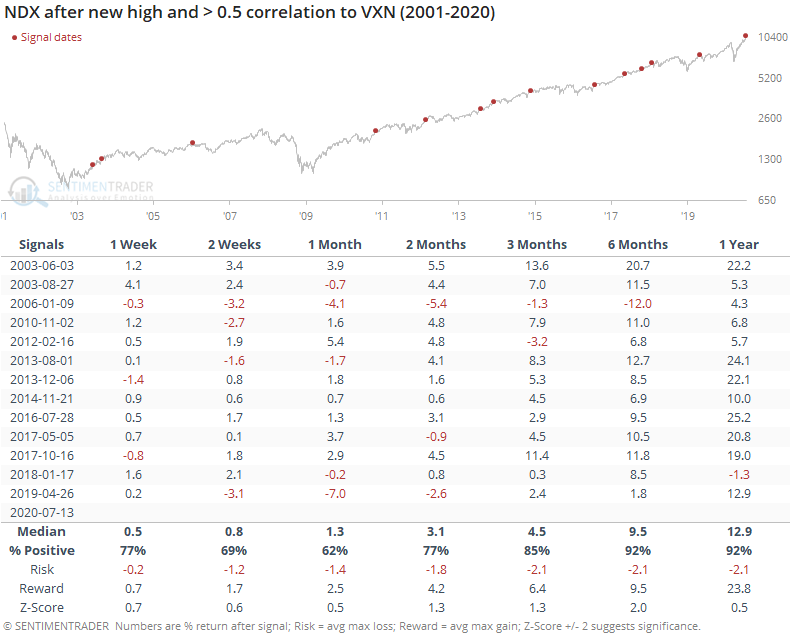
A high positive correlation between the NDX and VXN hasn't meant much for big tech stocks going forward, especially over the next 3-6 months, although the last two both preceded some shaky price action.

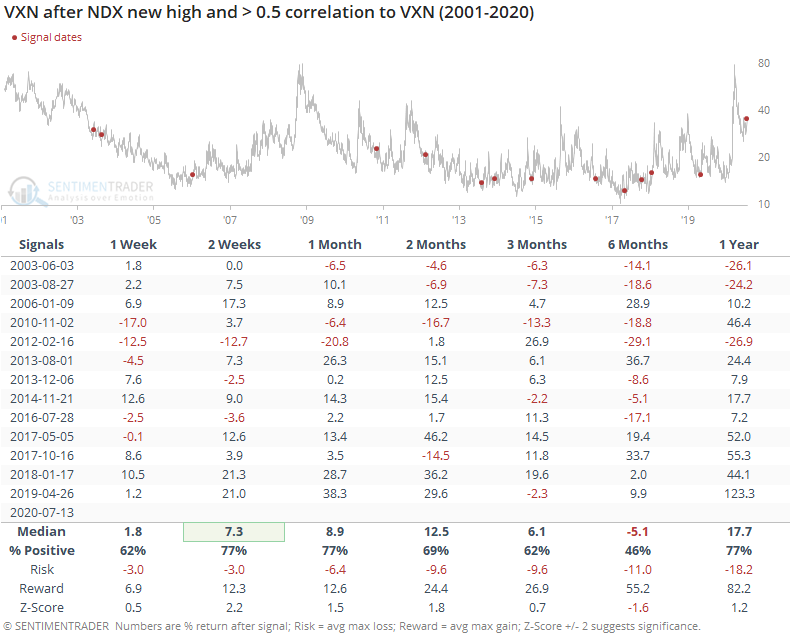
In the short-term, volatility continued to rise as the VXN typically jumped over the next 2-4 weeks.

For the broader market, it was more negative. Over the next two months, the S&P 500 showed a well-below-average return, and a poor risk/reward ratio.

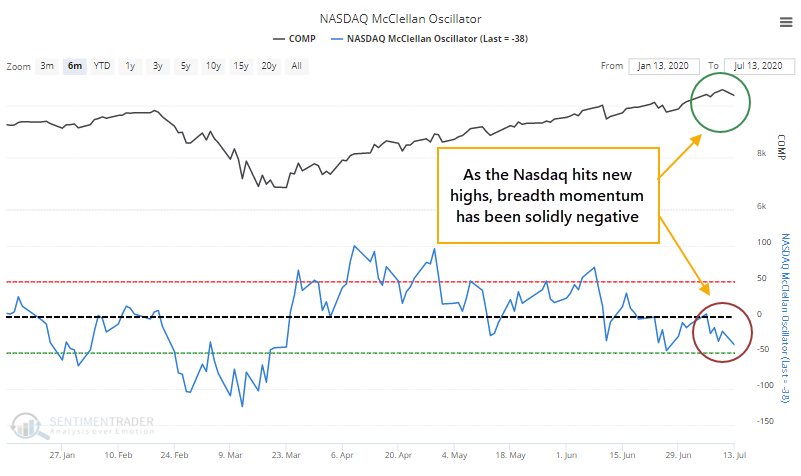
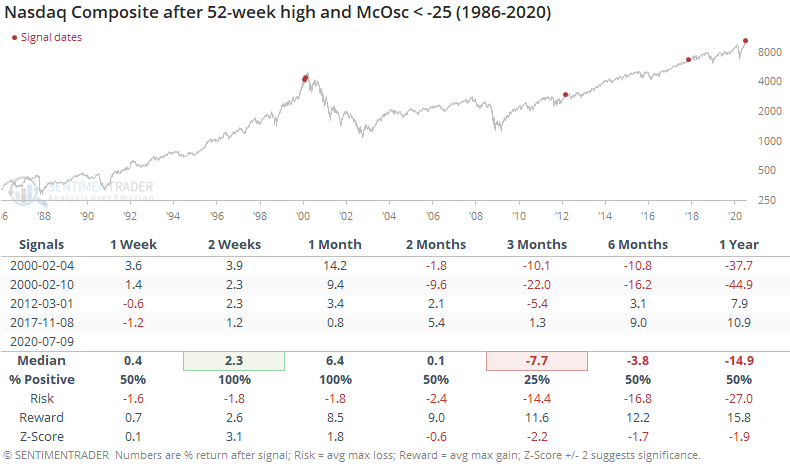
It's also odd that even while the Nasdaq Composite was setting record highs, momentum in breadth underlying that market has been poor. The McClellan Oscillator for the Nasdaq was below -25 even as the index was setting new highs.

That's only happened four other times since 1986. It certainly was not a good reason to sell tech stocks immediately, as the Composite added to its gains over the next 2-4 weeks. But those rallies also all ran into some trouble in the month(s) after that.

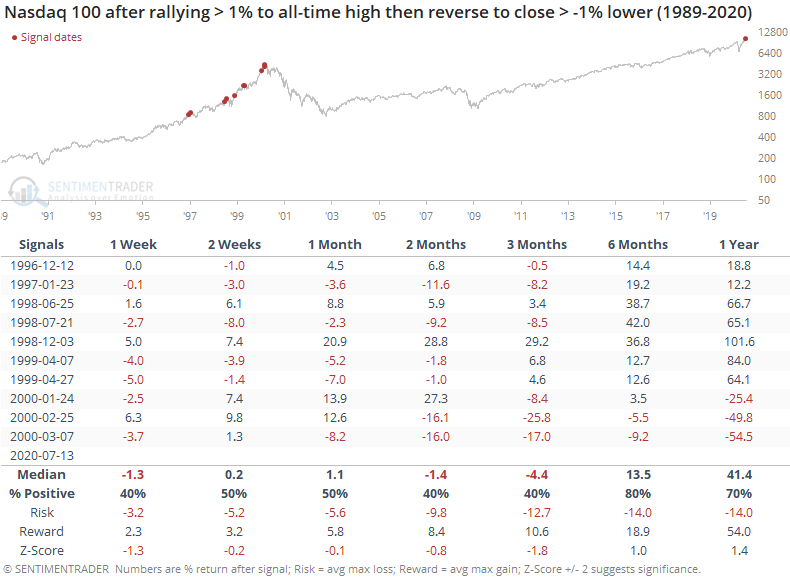
This is a little more troubling given Monday's rejection of a record high in the bigger tech stocks. As noted in yesterday's report, the Nasdaq 100 rallied more than 2% to an all-time high, only to reverse and close down by more than 1%. The only other day when that happened was March 7, 2000. Looking at smaller reversals, the tone over the next 2-3 months was still generally negative.

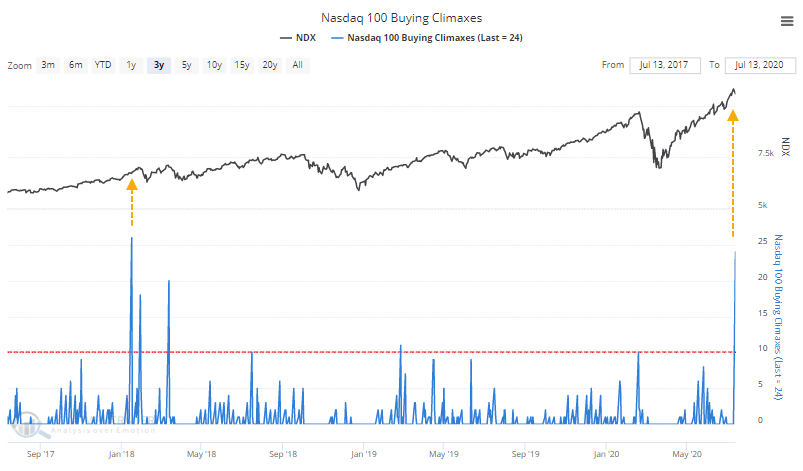
The reversal in the Nasdaq 100 coincided with the 2nd-largest number of buying climaxes in those stocks as well. Only early 2018 had more.

Overall, none of these oddities suggest an immediate worry. They're more of an environmental concern. The run in these stocks has been historic, and the momentum in many stocks underlying the move in the indexes is waning. Combined with reversals in some of them as we saw on Monday, it's a heads-up that we're unlikely to see them continue to run higher uninterrupted.

Sorry, you don't have access to this report

Upgrade your subscription plan to get access
Go to Dasboard
DATA &
TECHnologies
IndicatorEdge
‍
BackTestEdge
‍
Other Tools
‍
DataEdge API
RESEARCH
reports
Research Solution
‍
Reports Library
‍
actionable
Strategies
Trading Strategies
‍
Smart Stock Scanner
‍
FREE
RESOUrCES
Simple Backtest
Calculator
Simple Seasonality
Calculator
The Kelly Criterion
Calculator
Sentiment Geo Map
‍
Public Research Reports
‍
Free Webinar
COMPANY
‍
About
‍
Meet our Team
‍
In the News
‍
Testimonials
‍
Client Success Stories
Pricing
Bundle pricing
‍
Announcements
‍
FAQ
© 2024 Sundial Capital Research Inc. All rights reserved.
Setsail Marketing
TermsPrivacyAffiliate Program
Risk Disclosure: Futures and forex trading contains substantial risk and is not for every investor. An investor could potentially lose all or more than the initial investment. Risk capital is money that can be lost without jeopardizing ones’ financial security or life style. Only risk capital should be used for trading and only those with sufficient risk capital should consider trading. Past performance is not necessarily indicative of future results.

Hypothetical Performance Disclosure: Hypothetical performance results have many inherent limitations, some of which are described below. No representation is being made that any account will or is likely to achieve profits or losses similar to those shown; in fact, there are frequently sharp differences between hypothetical performance results and the actual results subsequently achieved by any particular trading program. One of the limitations of hypothetical performance results is that they are generally prepared with the benefit of hindsight. In addition, hypothetical trading does not involve financial risk, and no hypothetical trading record can completely account for the impact of financial risk of actual trading. for example, the ability to withstand losses or to adhere to a particular trading program in spite of trading losses are material points which can also adversely affect actual trading results. There are numerous other factors related to the markets in general or to the implementation of any specific trading program which cannot be fully accounted for in the preparation of hypothetical performance results and all which can adversely affect trading results.

Testimonial Disclosure: Testimonials appearing on this website may not be representative of other clients or customers and is not a guarantee of future performance or success.