Are homebuilding stocks flashing a warning sign for the broad market
Key points:
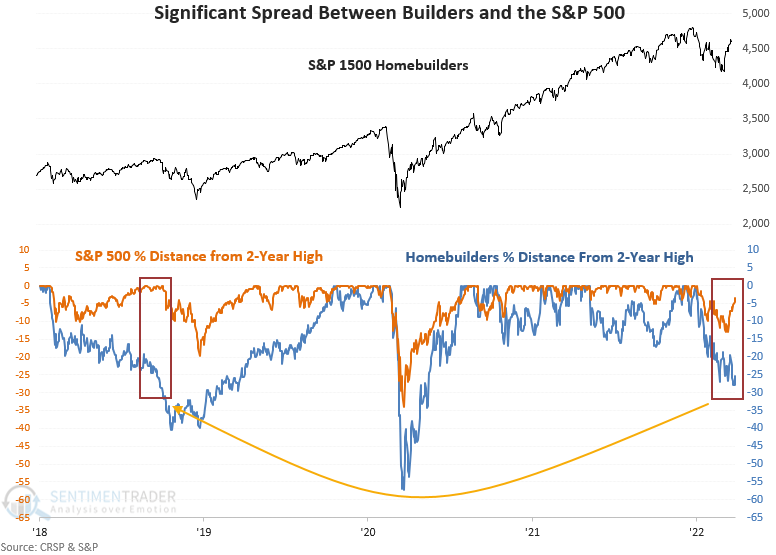
- The S&P 1500 homebuilders are currently trading down more than 27% from a 2-year high
- At the same time, the S&P 500 index is trading down less than 5% from its respective high
- The S&P 500 shows uninspiring results and some noteworthy signals around market peaks after similar divergences
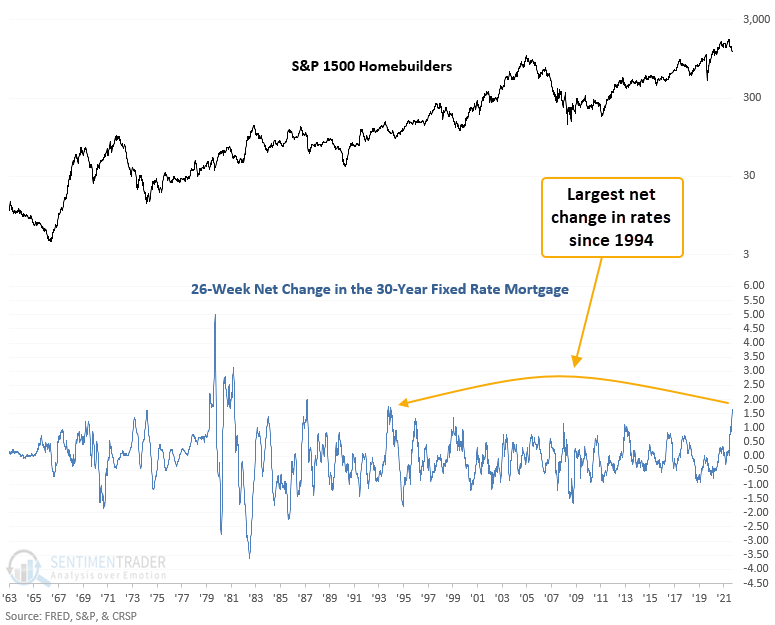
What's driving the severe underperformance in the builders
Homebuilders are among the most interest-rate sensitive equity industries. The 30-year fixed-rate mortgage has risen by 166 basis points over the trailing 26-week time frame, representing one of the most significant increases in the last 60 years.

Do homebuilders foreshadow an ominous outlook for the broad market
The severe underperformance by the builders relative to the broad market has been a hot topic among market commentators of late. According to the National Association of Home Builders, housing's combined contribution to GDP accounts for roughly 15-18%. So, does an industry that is highly sensitive to interest rates that also happens to be a key driver of GDP act as a leading indicator for the stock market?
Let's conduct a study to assess the outlook for the stocks when homebuilders are down 25% or more from a 2-year high. At the same time, the S&P 500 is down less than 5% from its respective high. To identify instances similar to the current signal, I will require the S&P 500 to be 4 months or fewer from the high. Finally, I screened out repeats are by waiting for the first signal in 2 months.
The previous divergence between the builders and the S&P 500 occurred in September 2018, which happens to be the last time Fed policy was less friendly.
Similar divergences suggest uninspiring results for the S&P 500
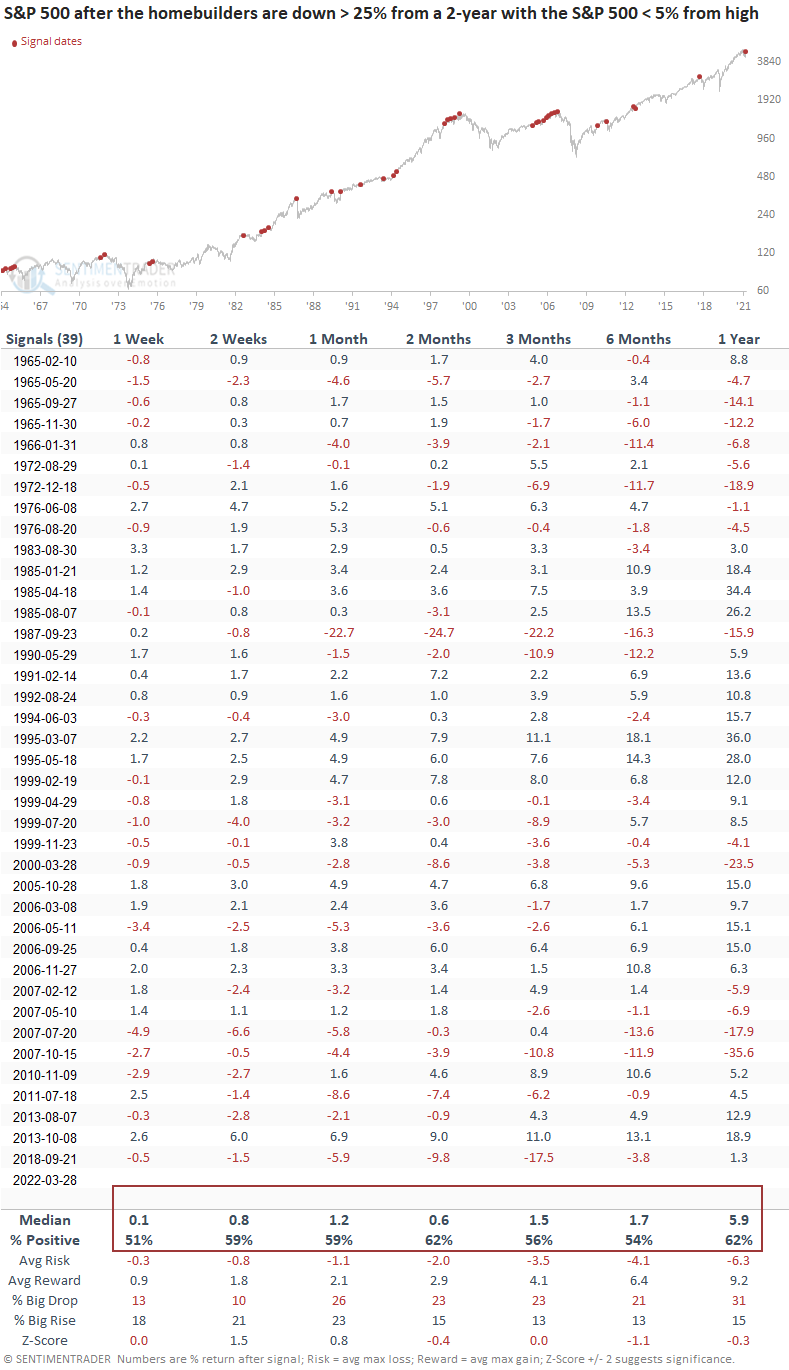
This signal has been triggered 39 other times over the past 57 years. After the others, S&P 500 future returns, win rates, and risk/reward profiles were uninspiring across medium and long-term time frames, especially in the 6-month window. If we review significant market peaks like 1966, 1972, 2000, and 2007, we see a cluster of signals. And I would also note that in all 4 instances, the first divergence triggered well ahead of the peaks. Some of the more timely alerts before significant drawdowns occurred in 1987, 1990, 2011, and 2018.
Similar divergences suggest one should avoid homebuilding stocks
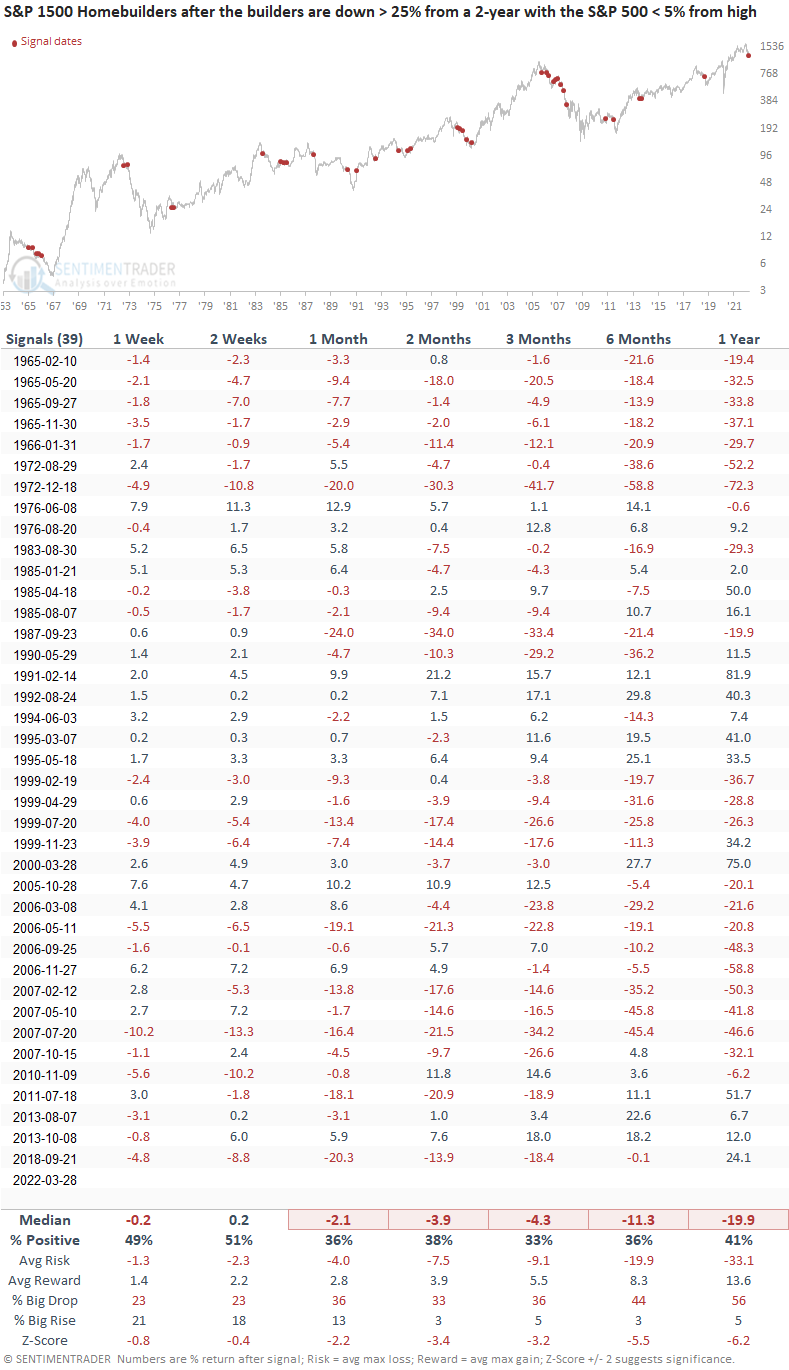
When I apply the signal dates to the S&P 1500 homebuilders, future returns, win rates, and risk/reward profiles look abysmal across all time frames. In the cases where the signal triggered well ahead of a market peak in the broad market, it didn't matter for builders. They continued to fall.
Similar divergences suggest a cautious outlook for the financial sector
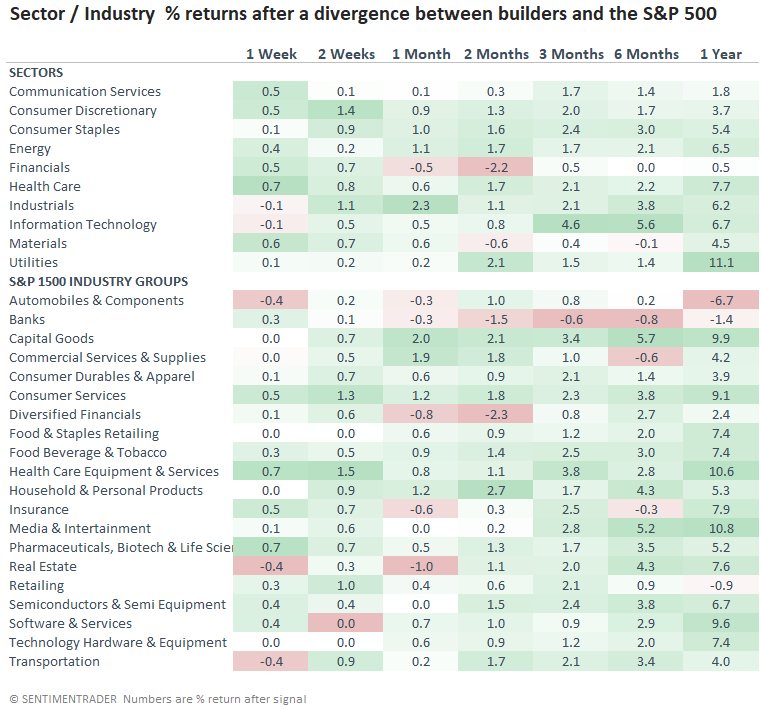
When I apply the signals to sectors and industry groups, the return table highlights a weak environment for financials. So, we need to be mindful that the severe underperformance by the builders is foreshadowing a potential slowdown in the economy that impacts value-oriented groups. The current slope of the yield curve is starting to agree.
Similar divergences suggest housing-related stocks could struggle
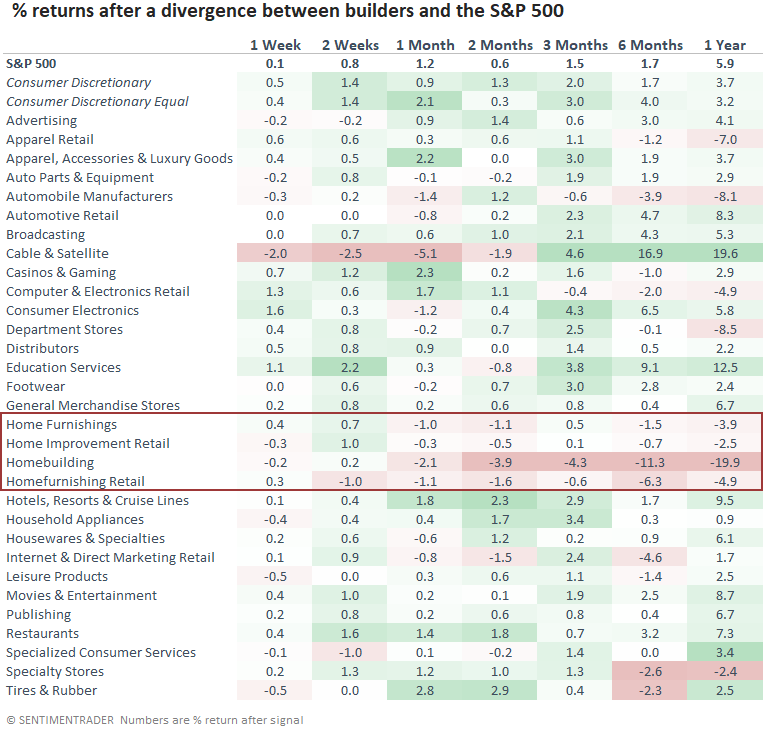
The sub-industry groups within the consumer discretionary sector show that housing-related groups tend to underperform when the builders diverge from the broad market. Except for a few groups, the 6-month time frame suggests that one should be looking for opportunities outside the discretionary sector.
What the research tells us...
When homebuilding stocks show a significant divergence relative to the S&P 500, we need to be mindful of the potential broad market message and the impact on consumer discretionary stocks, especially the builders. Similar setups to what we're seeing now have preceded uninspiring forward returns for the S&P 500 and an abysmal return outlook for the builders. The extreme underperformance of builders tends to impact a broader group of housing-related stocks. If the builders are signaling a potential slowdown in the economy, value-oriented groups could suffer, especially the financials. While the signal has triggered ahead of some significant market peaks, we need to remember that the warning can sometimes be untimely.

