Products
SentimenTrader Trading Tools
‍
Backtest Engine
My Trading Toolkit
Correlation Analysis
Seasonality
Market Prediction
Indicators & Data API
‍
Proprietary Indicators & Charts
Market Data API
Strategies & Scanner
‍
50+ Trading Strategies
Smart Stock Scanner
Smart Option Scanner
Research Reports
‍
Research Solutions
Reports Library
Free Resources
Simple Backtest Calculator
Simple Seasonality Calculator
The Kelly Criterion Calculator
Sentiment Geo Map
Public Research Reports
Education
Sentiment Indicators
Technical Indicators
Pricing
Company
About
In the News
Testimonials
Client Success Stories
Contact
Log inLoginSign up
< BACK TO ALL REPORTS

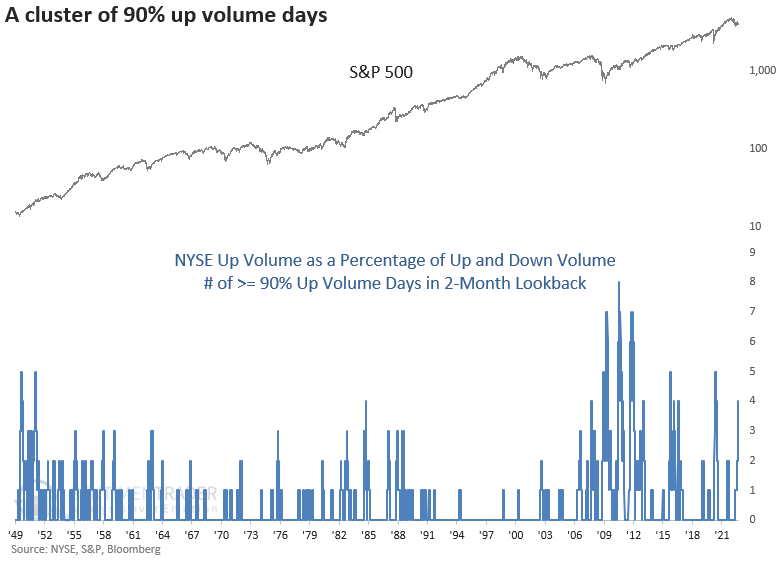
Another surge in advancing volume strengthens the bull case

Dean Christians
2022-09-12
NYSE up volume as a percentage of total volume exceeded 90% last Friday. The disproportionate amount of up volume has now occurred for the fourth time in two months. After similar volume-based signals, stocks were higher 91% of the time a year later.

Key points:

  • Volume in advancing shares as a percentage of total volume exceeded 90% on Friday
  • A 90% up volume day has now occurred four times in two months
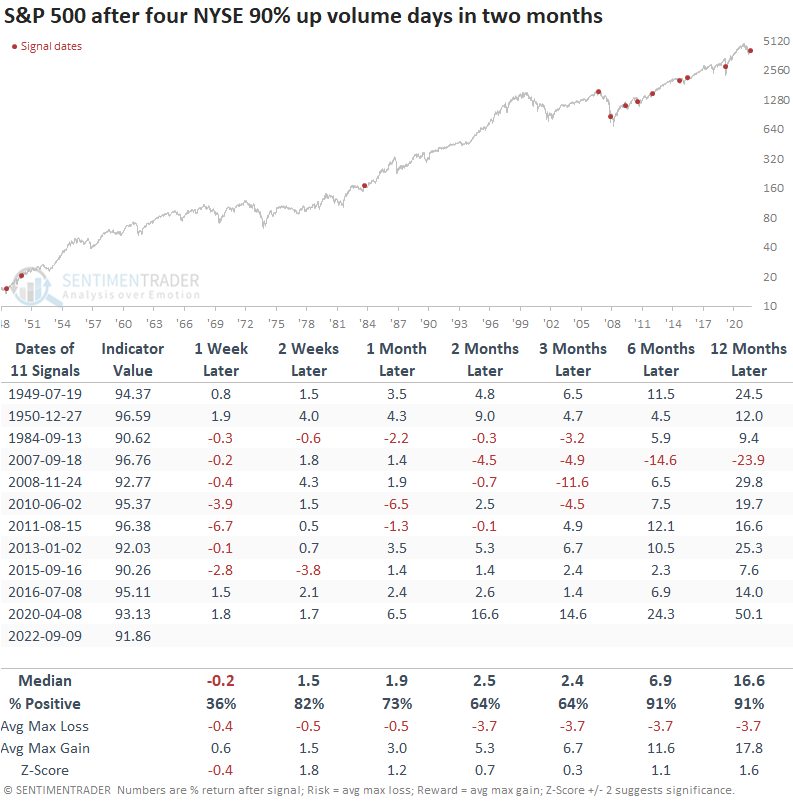
  • After similar clusters, the S&P 500 was higher 91% of the time a year later

Surging volume in advancing securities strengthens the bull case

A multi-week sell-off resulting in a 9% decline for the S&P 500 finally eased last week. 

The internal participation from constituent members was impressive on Friday, especially on the New York Stock Exchange. On that exchange, volume flowing into advancing securities as a percentage of total volume exceeded 90%. For these purposes, we ignore unchanged issues.

The lopsided volume has now occurred for the fourth time in two months. Historically, a cluster of 90% up volume days is bullish for the broad market as it represents overwhelming demand for stocks. 

In the following studies, the count of 90% days has to fall to zero before a new alert could trigger again in order to filter out repeat signals.

Similar conditions preceded excellent long-term results

Other clusters of four NYSE up volume days of 90% in two months led to a bullish long-term outcome for the S&P 500.

Weak returns over the next week are a good reminder that sometimes markets take a breather after a burst of buying demand. The only signal that didn't lead to positive six- and twelve-month returns was during the financial crisis.

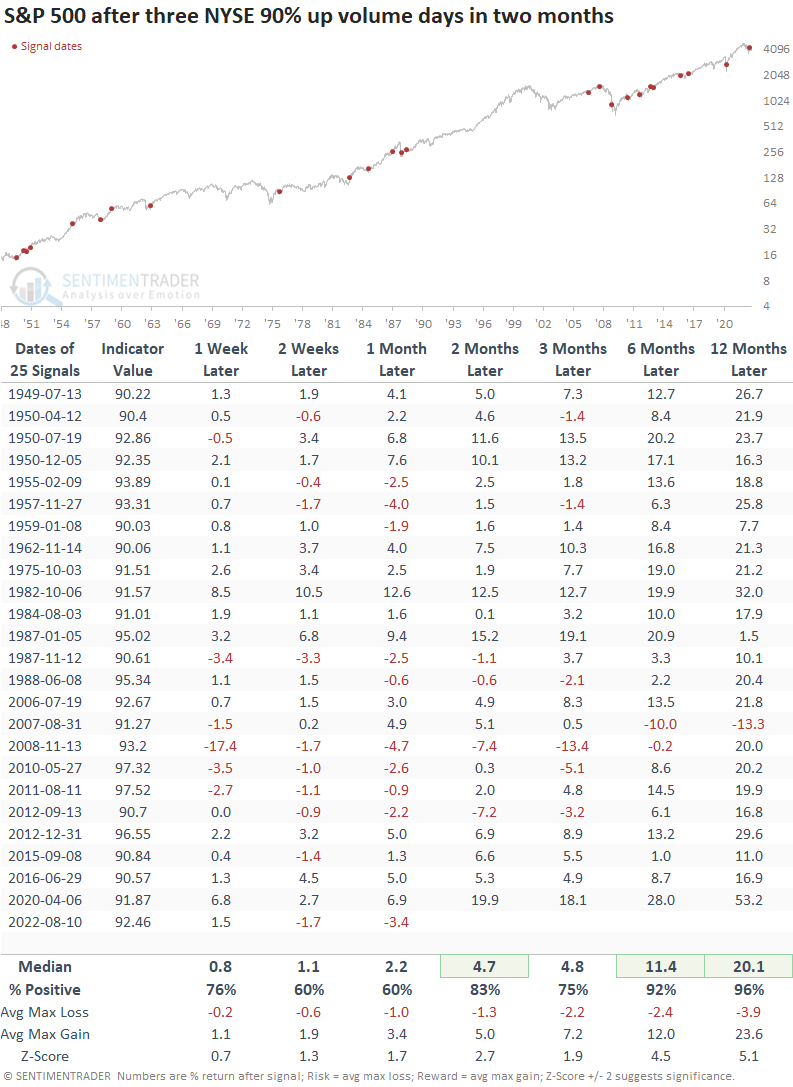
If we lower the threshold to three NYSE 90% up volume days in two months (instead of four), the sample size expands, and the results look even better. Drawdowns were minimal except for the couple that triggered during the global financial crisis.

Even a threshold of two NYSE 90% up volume days in two months looks impressive, with significance across all time frames.  

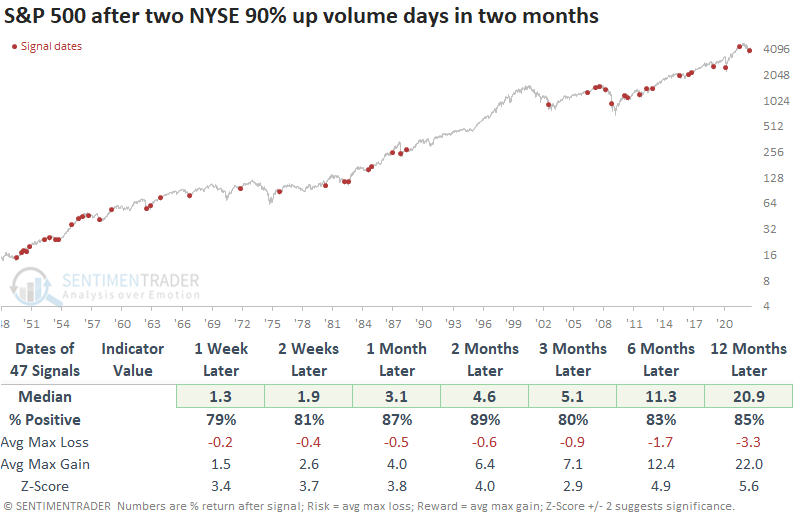
I screened out repeat signals in all three threshold level examples by requiring the count to fall to zero before a new alert could trigger again.

What the research tells us...

Demand for stocks returned last week with the fourth NYSE 90% up volume day in two months. Historically, a cluster of 90% up volume days has been bullish for stocks, especially 6 and 12 months later. Over more than 70 years of history, the only negative long-term return occurred during the largest financial crisis since the Great Depression.

PRODUCTS
SentimenTrader
Trading Tools
Indicators & Data API
‍
Strategies & Scanner
‍
Research Reports
FREE
RESOUrCES
Simple Backtest
Calculator
Simple Seasonality
Calculator
The Kelly Criterion
Calculator
Sentiment Geo Map
‍
Public Research Reports
‍
Education
Sentiment Indicators
‍
Technical Indicators
‍
Pricing
Bundle pricing
‍
FAQ
‍
Announcements
‍
COMPANY
‍
About
‍
In the News
‍
Testimonials
‍
Client Success Stories
CONTACT
‍
General Inquiries
‍
Media Inquiries
‍
Financial Professionals Inquiries
‍
© 2026 Sundial Capital Research Inc. All rights reserved.
Setsail Marketing
TermsPrivacyAffiliate Program
Risk Disclosure: The information and tools provided are for research and analytical purposes only and are not intended as investment advice. Market analysis involves uncertainty, and outcomes may differ from expectations. Users should conduct their own due diligence and consider their individual circumstances before making any financial decisions. Past performance is not necessarily indicative of future results.

Hypothetical Performance Disclosure: Hypothetical performance results have many inherent limitations, some of which are described below. No representation is being made that any account will or is likely to achieve profits or losses similar to those shown; in fact, there are frequently sharp differences between hypothetical performance results and the actual results subsequently achieved by any particular trading program. One of the limitations of hypothetical performance results is that they are generally prepared with the benefit of hindsight. In addition, hypothetical trading does not involve financial risk, and no hypothetical trading record can completely account for the impact of financial risk of actual trading. for example, the ability to withstand losses or to adhere to a particular trading program in spite of trading losses are material points which can also adversely affect actual trading results. There are numerous other factors related to the markets in general or to the implementation of any specific trading program which cannot be fully accounted for in the preparation of hypothetical performance results and all which can adversely affect trading results.

Testimonial Disclosure: Testimonials appearing on this website may not be representative of other clients or customers and is not a guarantee of future performance or success.