
Another "Risk On/Risk Off" Measure Flashes Yellow

The concept of a "Risk On/Risk Off" indicator is an attractive one. Everyone knows there is a time to be fully invested and a time when it may be desirable to be less so. In the real world of trading the holy grail of "to be in or not to be in" still does not exist (and sadly, never will). But there are certain measures that can offer some useful weight-of-the-evidence to help investors determine how aggressive to be at any given point in time.
The T-Bill/Aggregate Bond Index Risk On/Risk Off Model
The T-Bill/Aggregate Bond Index Risk On/Risk Off Model presented below is a fairly rudimentary indicator that for our purposes here:
- Is updated only at the end of each quarter
- Any signal generated at the end of a quarter applies for the entire following quarter
This indicator:
- Is set to switch from Risk On to Risk Off after the close on 3/31/2021
- Will remain in Risk Off mode until at least 6/30/2021.
- The last Risk Off period was from 12/31/2019 through 3/31/2020
Does this mean that investors should sell everything and head for the hills? Not necessarily. First off, we are not talking precision market timing here. In fact, historically Risk-Off periods have seen the S&P 500 advance 69% of the time.
So what gives? In a nutshell, when the S&P 500 Index is good during a Risk Off period it is OK. But when it is bad, it is often extremely bad. Details to follow.
The Calculations
The rules for designating the next quarter as Risk On or Risk Off are as follows:
A = total return for 3-month T-bills over the previous 3 months
B = total return for Barclays Aggregate Bond Index for the previous 3 months
C = B - A (i.e., 3-month total return for Aggregate Index minus 3-month total return for T-bills)
If C >= 0 then "Risk On" for the next quarter (i.e., if Aggregate return > T-bill return)
If C < 0 then "Risk Off" for the next quarter (i.e., if Aggregate return < T-bill return)
Results
We start our test on 9/30/1975 using monthly total return data for:
- 3-month T-bills
- Bloomberg Barclays Aggregate Bond Index
- S&P 500 Index
- Bloomberg Barclays Treasury Intermediate Index
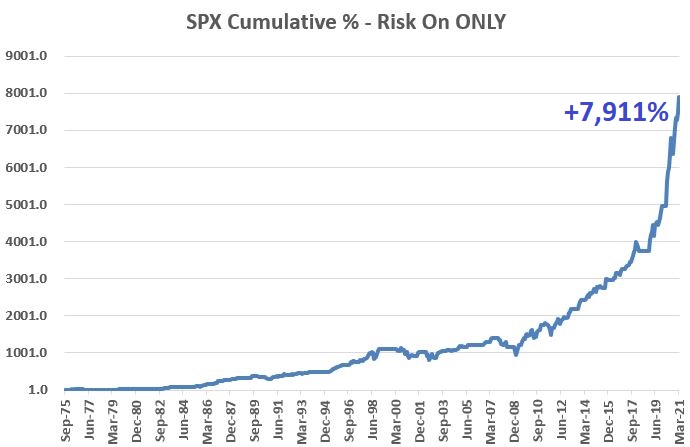
The chart below displays the cumulative total return for the S&P 500 Index during the 111 quarters designated as "Risk On".
The chart below displays the cumulative total return for the S&P 500 Index during the 71 quarters designated as "Risk Off".
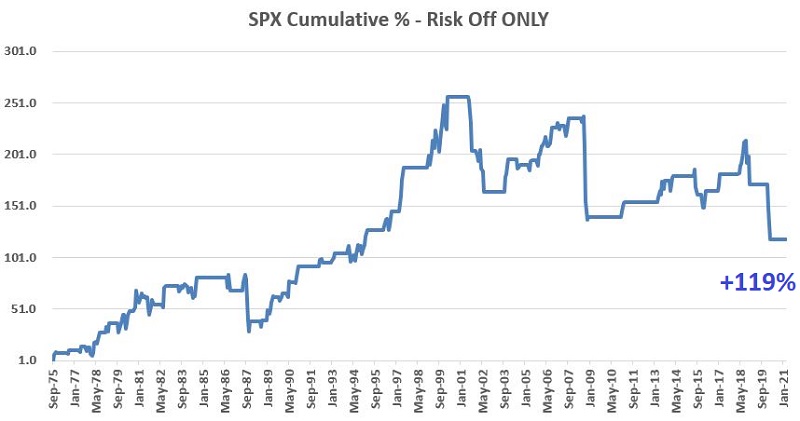
Things to note in the chart above:
As mentioned above, the S&P 500 Index clearly advanced more often than it declined during quarters designated as Risk Off. HOWEVER, this method also warned investors ahead of:
- The Crash of '87
- The Dotcom collapse in 2000-2002
- The Financial Crisis of 2008
- The Covid selloff of 2020
...which is kind of what you want a Risk Off indicator to do - i.e., warn you of potential trouble.
The table below displays relevant performance figures for the S&P 500 Index during the Risk On quarters versus the Risk Off quarters.
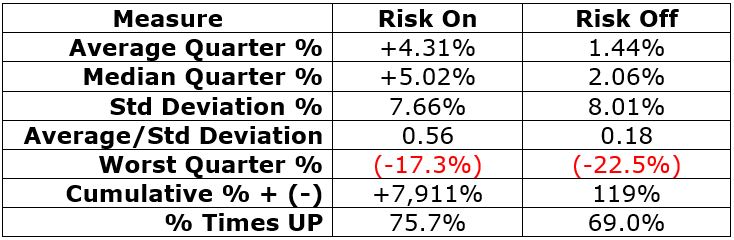
There are a few key things to note:
- Clearly, the S&P 500 Index has performed much better when this particular indicator has been in Risk On mode
- At the same time, Risk On is clearly NOT synonymous with "risk-free" (note the -17.28% worst quarter and the fact that roughly one-quarter of all Risk On periods saw the S&P 500 decline)
- Finally, one might also note that although performance was much less during Risk Off periods, it was still positive. As a result, one might wonder if there is really a benefit to getting out of the market during Risk Off periods.
Let's address that last point. Let's assume that during Risk Off periods we held intermediate-term treasury bonds instead of holding the S&P 500 Index (for testing purposes we will use monthly total return data for the Bloomberg Barclays Treasury Intermediate Index).
The chart below displays the total return achieved by holding intermediate-term Treasuries (blue line) versus the total return achieved by holding the S&P 500 Index (orange line) ONLY DURING RISK OFF quarters since 1975.
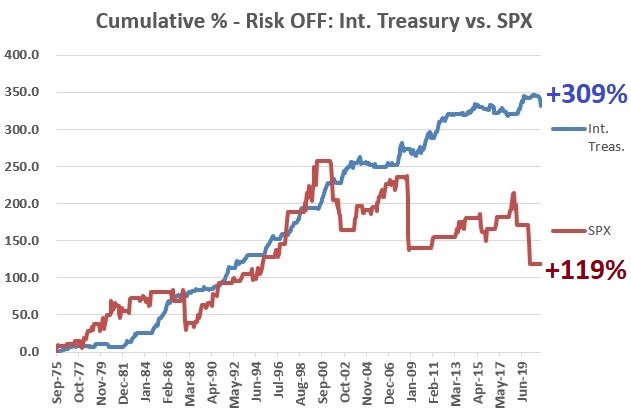
In a classic case of "The Tortoise and the Hare", suddenly that 69% winning percentage for the S&P 500 Index during Risk Off quarters doesn't look all that attractive.