
Another risk-on signal to confirm a favorable trend

Key points
- Our Risk On / Risk Off indicator calculates the percentage of core indicators that are presently "Risk On"
- This indicator can be used in a trend-following manner, where rising and/or high readings are best
- A longer-term variation of this indicator just flashed a favorable signal for stocks
Risk On / Risk Off using a 50-day moving average
Investors have been in risk-on mode for a while. Actually, for most of the past two years.
There have only been two periods when there were consistently more risk-off than risk-on indicators in our Risk On / Off Indicator.
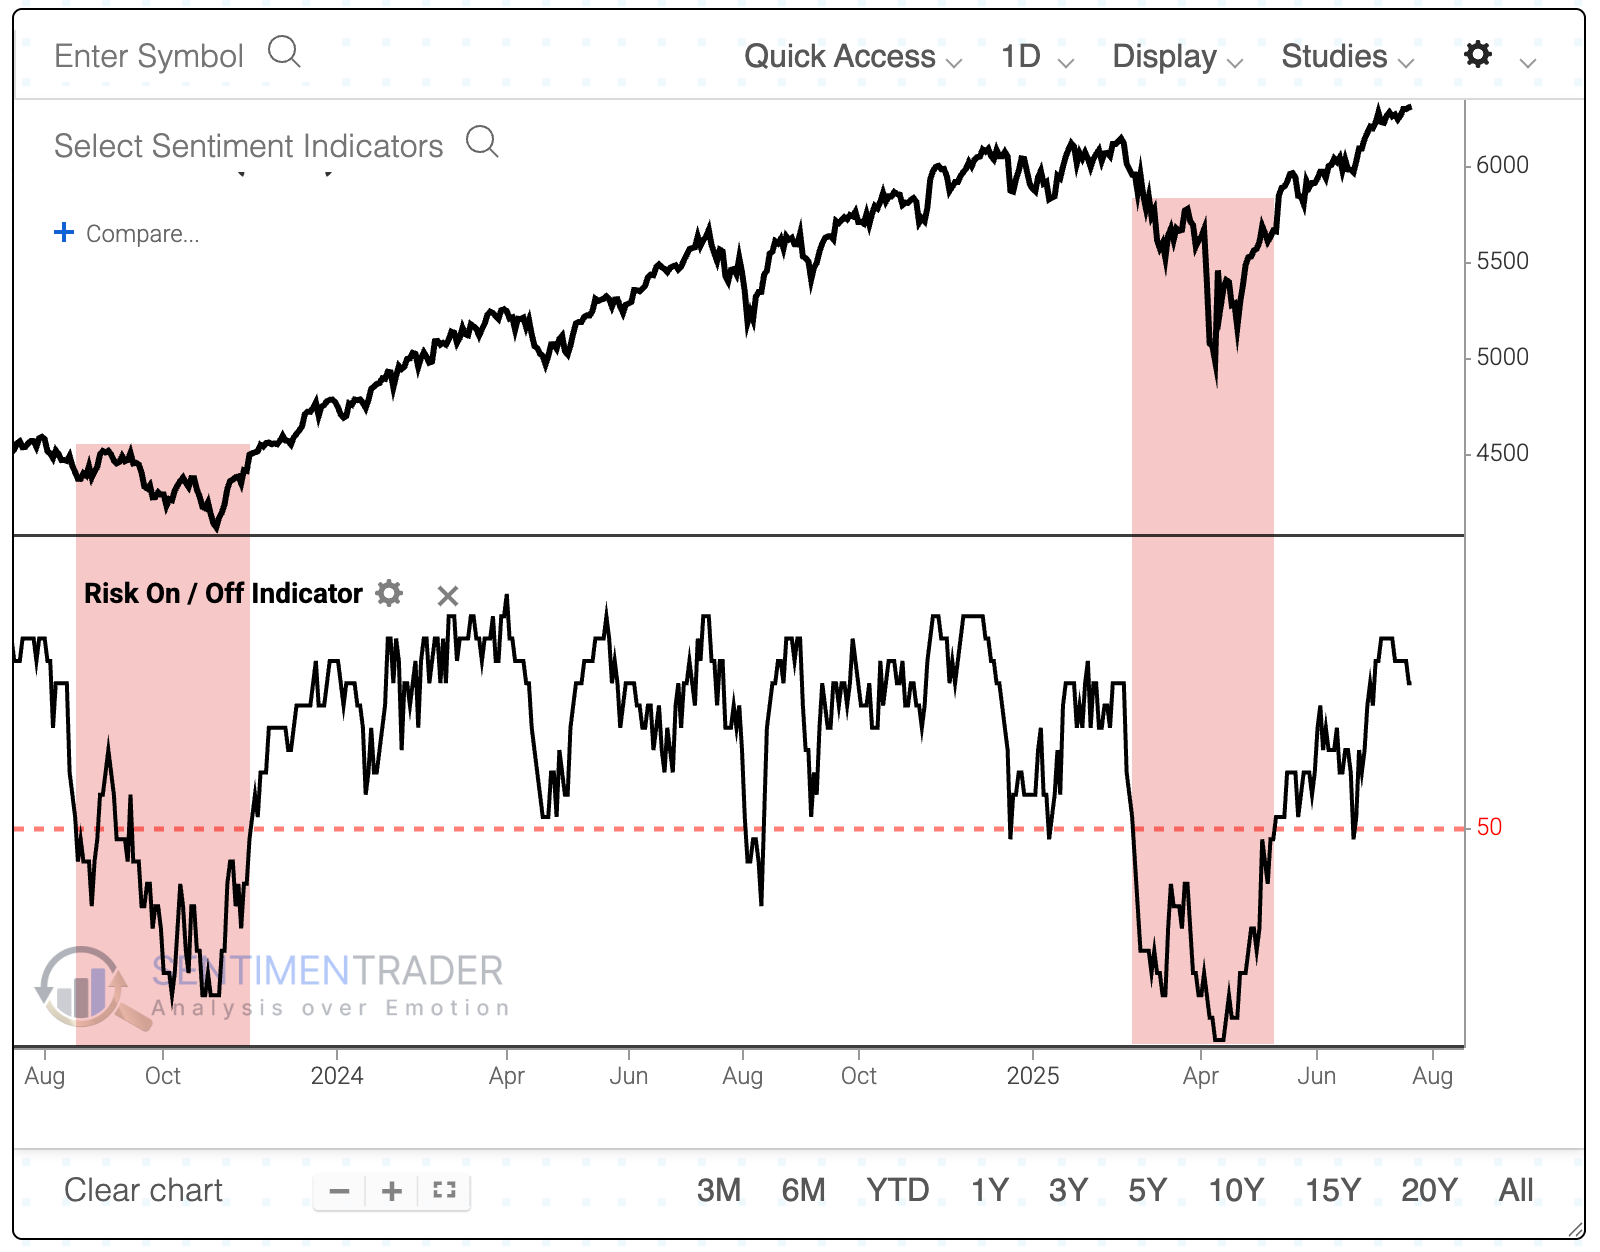
Since investors have been in risk-on mode for a while, we'll take a look to see if they've been too risk on. For this note, we look at a 50-day moving average of the Risk On / Risk Off indicator in the Backtest Engine.
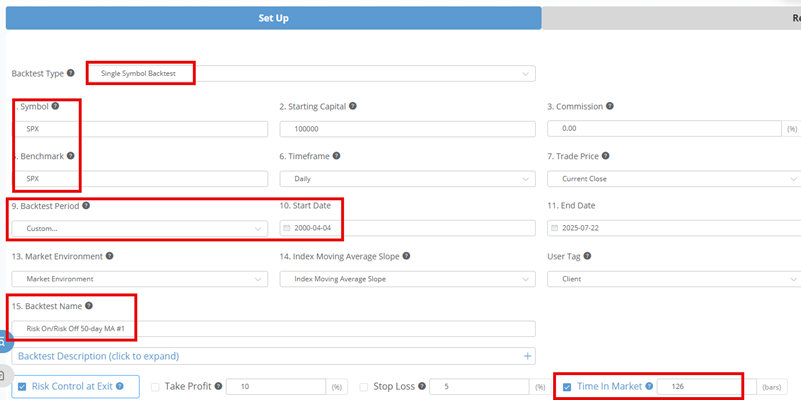
The screenshot below shows the first test Setup input screen. We will examine the S&P 500 index starting with the April 2000 inception of our Risk On / Risk Off indicator. We will use a six-month holding period.
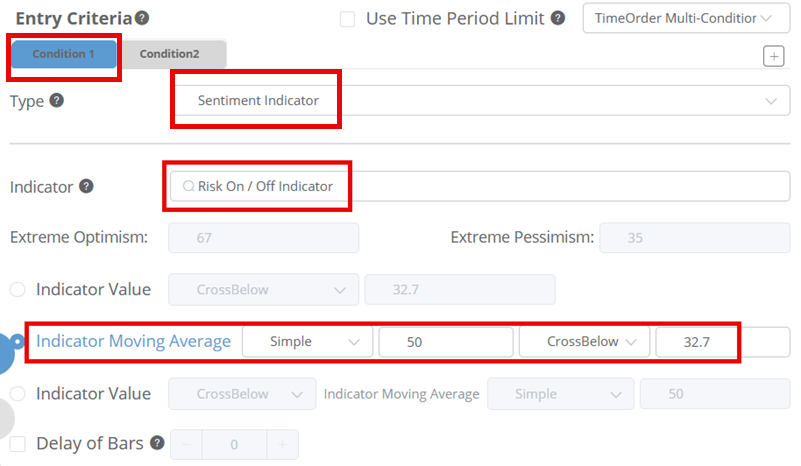
To generate a signal, we will require two conditions. First, the 50-day average for Risk On / Risk Off must drop below 32.7%, as shown below.
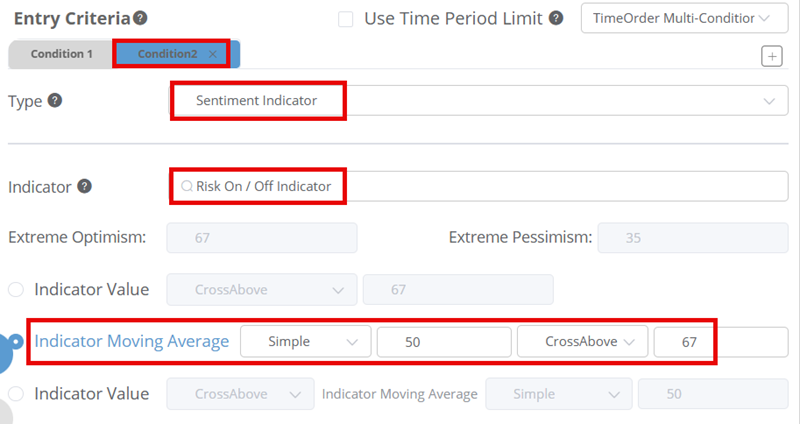
Once that condition is met, the bullish trigger occurs when the 50-day average exceeds 67% as shown below. To add a condition, change the Entry Criteria to "TimeOrder Multi-Condition."
In the chart below, the S&P 500 appears in the top pane. A green arrow appears when the 50-day average of the Risk On / Risk Off indicator falls below 32.7% and then rises above 67%. The exit dates, 126 trading days after a green arrow, are highlighted with a red arrow.
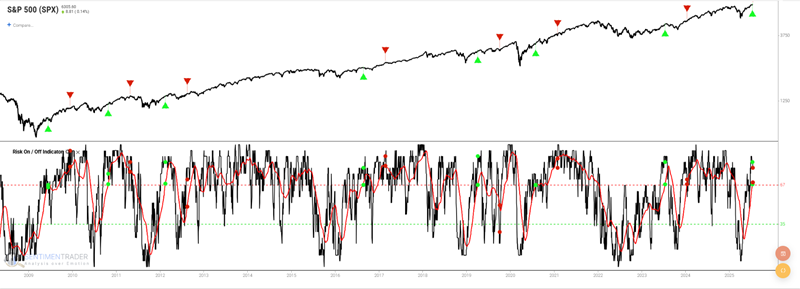
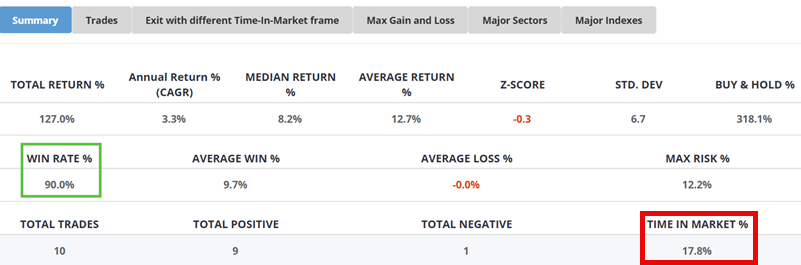
This strategy was only in the market 17.8% of the time, yet generated a return of 127%. The only unfavorable trade so far is the current one, which only triggered a few sessions ago and still has almost six months to go.
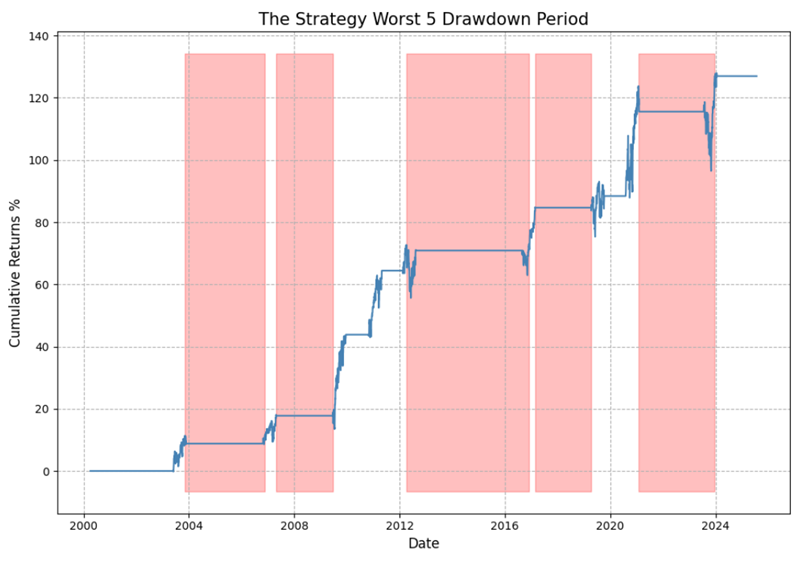
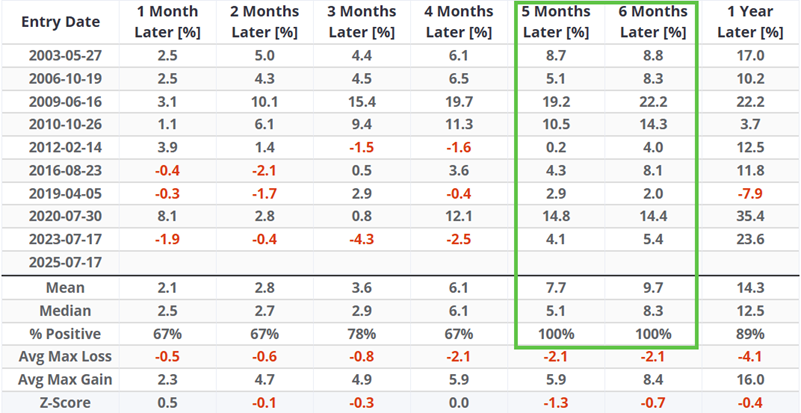
The hypothetical cumulative percentage return from holding the S&P 500 index for six months after each signal has a shape of lower-left-to-upper-right that represents the consistency that most investors look for in a trading strategy.
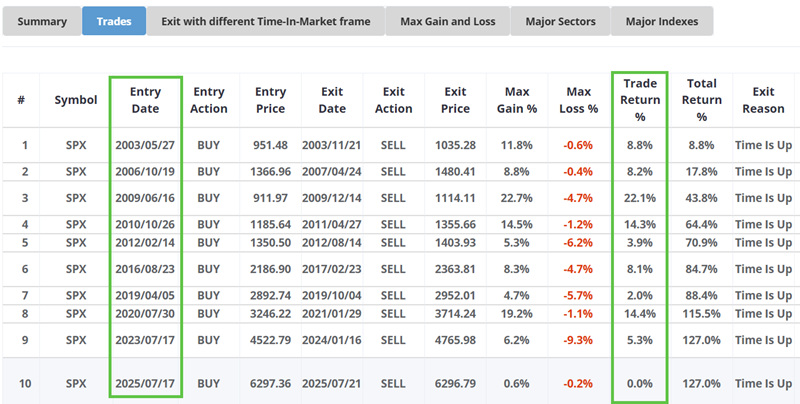
The individual trades are shown below, and we can see that not only are they all positive, but the max loss during the six-month holding periods was relatively minor, with none exceeding 10%.
Looking at other time frames, note that both five- and six-month returns showed a gain 100% of the time.
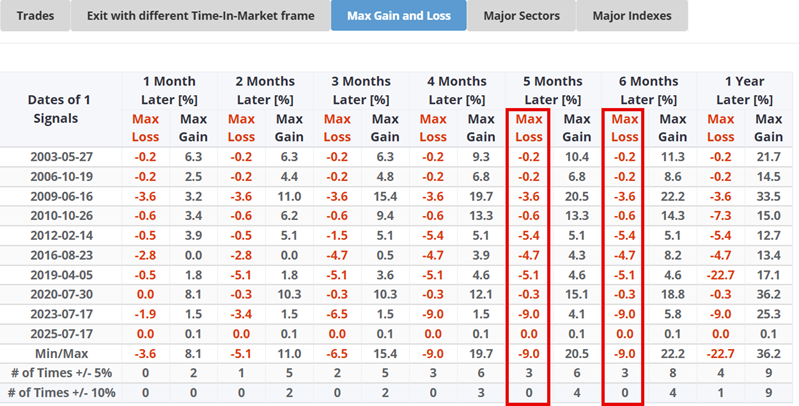
Positive results are great, but in real-world trading, one relevant question is, "How much of a loss, if any, did a trader have to endure in order to ultimately achieve a gain?"
That's what the Max Gain and Loss tab shows us. The worst loss at any point during the five- and six-month periods after a signal was 9.0%.
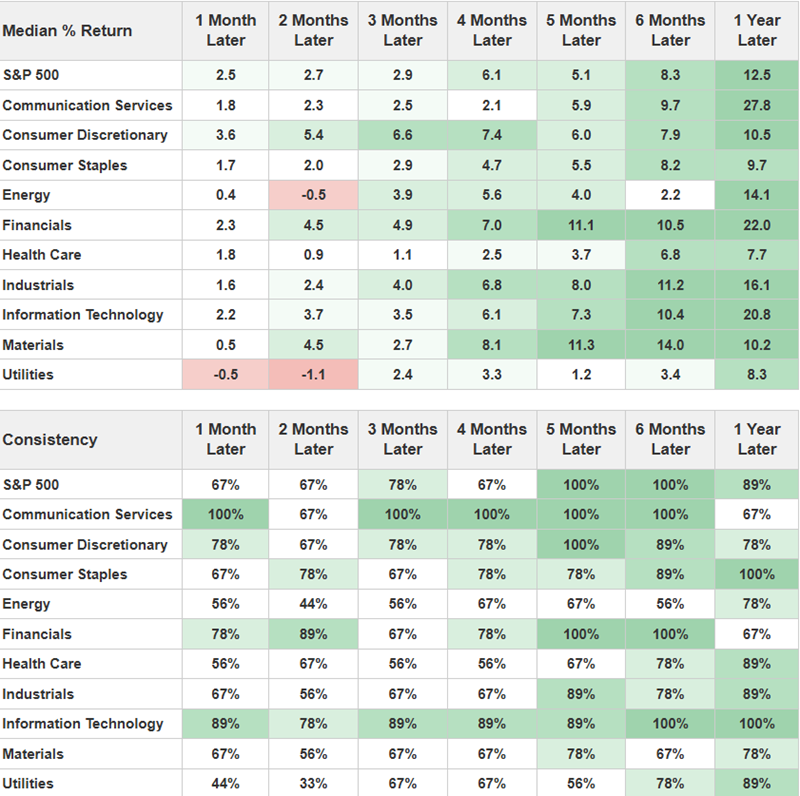
After these risk-on signals, cyclical sectors tended to perform well. Discretionary, financial, and technology stocks witnessed strong, consistent gains over the following five and six months, furthering the momentum in those areas as Dean recently discussed.
To load this test yourself, click here and then click the Run Backtest button to view the results. To be alerted anytime this signal occurs in the future:
- Navigate to the Backtest Engine and click the Analysts' Backtests tab.
- Click the plus button on the right-hand side to add the test to your alerts
- Go to My Stuff > My Signal and confirm that it has been added to your signals, where you'll be alerted when the conditions are met (you'll also receive an email)
What the research tells us…
Momentum is an essential factor in the stock market. When most investors shift to a risk-on mindset, their continued aggressive buying can propel the stock market significantly higher over an extended period.
While we aim to identify risk-on behavior as early as possible within a given cycle, the results detailed above remind us that even late has been better than not at all when jumping onto a bullish stock market trend.