Data &
Technology
Research
Reports
Report Solutions
Reports Library
Actionable
Strategies
Free
Resources
Simple Backtest Calculator
Simple Seasonality Calculator
The Kelly Criterion Calculator
Sentiment Geo Map
Public Research Reports
Free Webinar
Pricing
Company
About
Meet Our Team
In the News
Testimonials
Client Success Stories
Contact
Log inLoginSign up
< BACK TO ALL REPORTS

Another Morning, Another Opening Loss

Jason Goepfert
2016-01-20
null

Another morning, another large opening loss.

The S&P 500 futures are indicated to open down more than 1.5% below Tuesday's close, marking the 5th opening gap of -1.5% or more in 12 days. In the history of S&P futures, only three time periods had this tight of a cluster of large negative opening gaps:

  • Late October 1987 (aftermath of Black Monday)
  • October-December 2008 (aftermath of the financial crisis)
  • March 2009 (bottom of bear market)

There were several time periods that saw 4 gaps in 12 days, all medium-term bottoms:

  • November 7, 1997
  • September 21, 1998
  • June 4, 2010
  • August 19, 2011
  • September 19, 2011

Clearly, an unusual situation. What's also notable about today's indicated open is that it is occurring when sentiment is already panicked.

Like recession indicators, we could pick and choose among hundreds of indicators to confirm whatever we want to suggest, but we always try to most heavily weight model-based readings. These are objective, not subject to cherry-picking and proven in real-time through market cycles.

As of Tuesday's close, the spread between the Smart Money Confidence and Dumb Money Confidence was +49%, down a bit from the previous day.

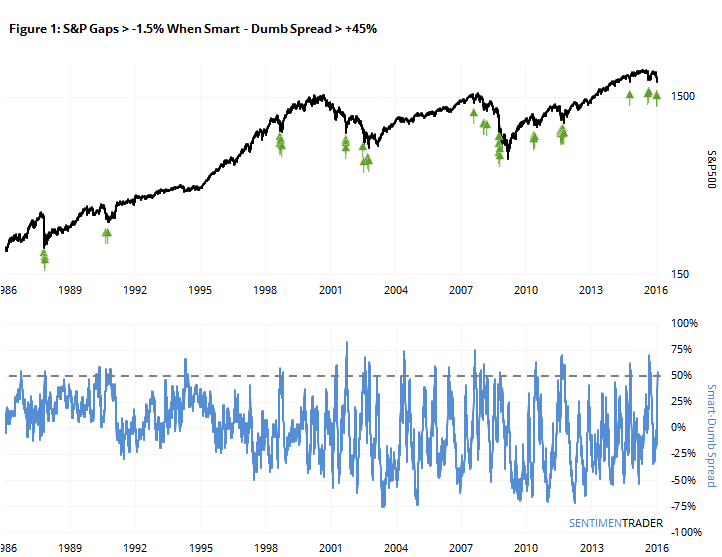
Figures 1 and 2 show the performance of the S&P futures from the opening print on any day that they opened down at least -1.5% and the Confidence Spread was +45% or greater.

20160120_gap_chart 20160120_gap

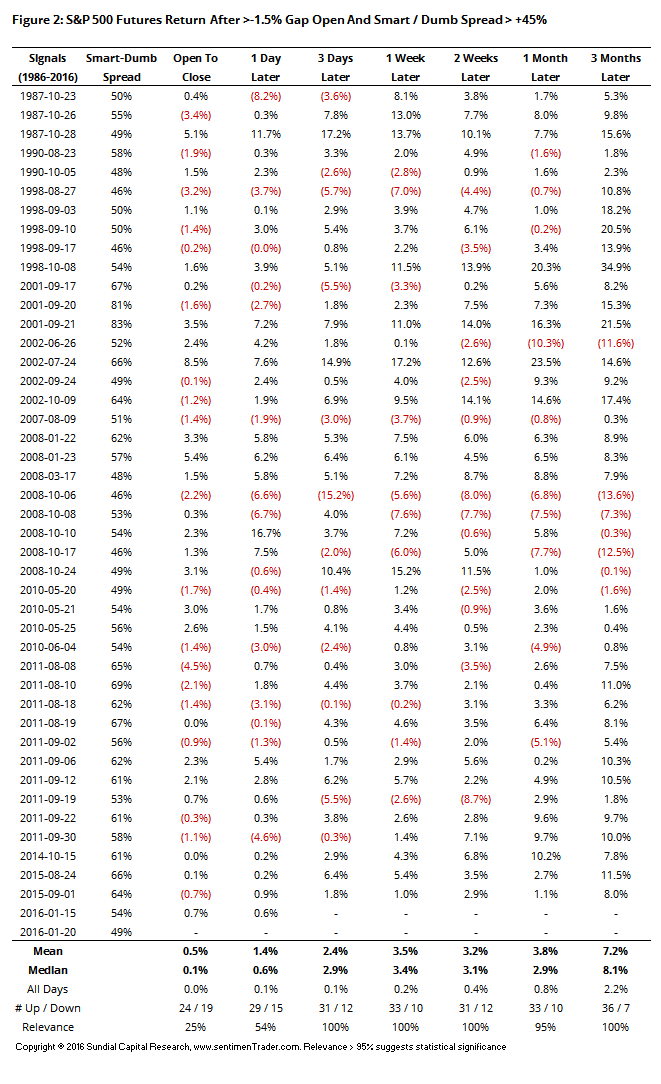
Same-day performance was mixed, but improved dramatically as we moved out the time frame. The only real failures were in June 2002 and during the midst of the October 2008 collapse.

The highest-probability risk at the moment is if the major indexes, primarily the S&P 500, move below its August lows. That could trigger a round of stop-loss orders during the day and bleeding into the next 1-2 days. Margin call selling is a small possibility. A quick loss of an additional 5%+ would not be out of line in that case and if we saw anything like that, then there would be an exceptionally high probability of higher prices over the next several weeks to several months.

The safer bet in kinda-sorta panic situations like this would be to wait for the S&P to exceed the high from the previous day, about 1900 in our current case. That is not foolproof by any means, but it does tend to capture most of the upside of these rebounds while preventing one from buying into a possible collapse. The risk in those cases is that one is buying into rising prices in a downtrend, subject to reversal, so (wide) stop losses are recommended.

Sorry, you don't have access to this report

Upgrade your subscription plan to get access
Go to Dasboard
DATA &
TECHnologies
IndicatorEdge
‍
BackTestEdge
‍
Other Tools
‍
DataEdge API
RESEARCH
reports
Research Solution
‍
Reports Library
‍
actionable
Strategies
Trading Strategies
‍
Smart Stock Scanner
‍
FREE
RESOUrCES
Simple Backtest
Calculator
Simple Seasonality
Calculator
The Kelly Criterion
Calculator
Sentiment Geo Map
‍
Public Research Reports
‍
Free Webinar
COMPANY
‍
About
‍
Meet our Team
‍
In the News
‍
Testimonials
‍
Client Success Stories
Pricing
Bundle pricing
‍
Announcements
‍
FAQ
© 2024 Sundial Capital Research Inc. All rights reserved.
Setsail Marketing
TermsPrivacyAffiliate Program
Risk Disclosure: Futures and forex trading contains substantial risk and is not for every investor. An investor could potentially lose all or more than the initial investment. Risk capital is money that can be lost without jeopardizing ones’ financial security or life style. Only risk capital should be used for trading and only those with sufficient risk capital should consider trading. Past performance is not necessarily indicative of future results.

Hypothetical Performance Disclosure: Hypothetical performance results have many inherent limitations, some of which are described below. No representation is being made that any account will or is likely to achieve profits or losses similar to those shown; in fact, there are frequently sharp differences between hypothetical performance results and the actual results subsequently achieved by any particular trading program. One of the limitations of hypothetical performance results is that they are generally prepared with the benefit of hindsight. In addition, hypothetical trading does not involve financial risk, and no hypothetical trading record can completely account for the impact of financial risk of actual trading. for example, the ability to withstand losses or to adhere to a particular trading program in spite of trading losses are material points which can also adversely affect actual trading results. There are numerous other factors related to the markets in general or to the implementation of any specific trading program which cannot be fully accounted for in the preparation of hypothetical performance results and all which can adversely affect trading results.

Testimonial Disclosure: Testimonials appearing on this website may not be representative of other clients or customers and is not a guarantee of future performance or success.