
Another look at the beaten down healthcare sector

Key points
- The healthcare sector has experienced significant weakness relative to the overall market
- On a trend-following basis, the sector has recently experienced a steep decline
- On the plus side, several generally reliable indicators are suggesting better days ahead for this downtrodden sector
- History suggests that investors should start to look for opportunities in this beaten-down sector
The fly in the ointment
There are two questions regarding the healthcare sector. The first question is, "Are better days ahead for this beaten-down sector?" As we will highlight shortly, there is a compelling argument to answer that question with a "Yes." However, the second question is, "Is this the time to buy?" That is a more difficult question to answer.
Buying into a sharp decline can provide maximum opportunity if a sharp rebound unfolds. On the flip side, this action can also become more like trying "to catch a falling safe." The chart below displays the price action for the Health Care Select Sector SPDR Fund ETF (XLV)-which is designed to track the S&P 500 Healthcare Sector-along with its 200-day moving average.
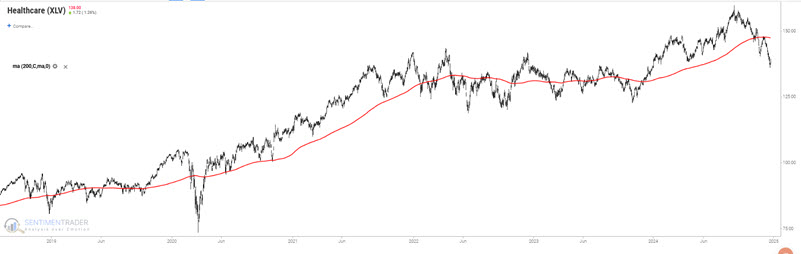
At the far right in the chart above, we see that the ETF has plunged over -13% since early September 2024. It has also remained essentially unchanged over the last four years and is trading below a declining 200-day moving average. While this ETF has bounced back from a similar situation several times in the previous several years, it is still far from an ideal setup on a trend-following basis.
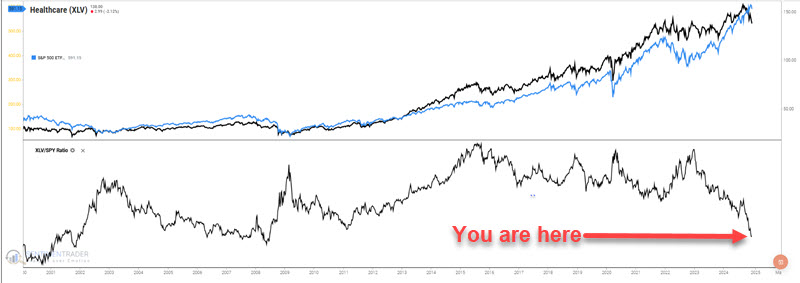
In addition, the chart below displays the performance of XLV relative to the S&P 500 Index (represented by ticker SPY). The top clip shows the performance of both ETFs (XLV in black and SPY in blue). The bottom clip displays the performance of XLV relative to the performance of SPY. At the far right, we see a steep decline in relative performance.
Buying into a plunging situation is fraught with peril and is generally considered a risky move. That said, while whether this is the exact moment to buy into the healthcare sector is open to debate, an opportunity regarding the year ahead does appear to be forming.
Few healthcare stocks in a strong uptrend
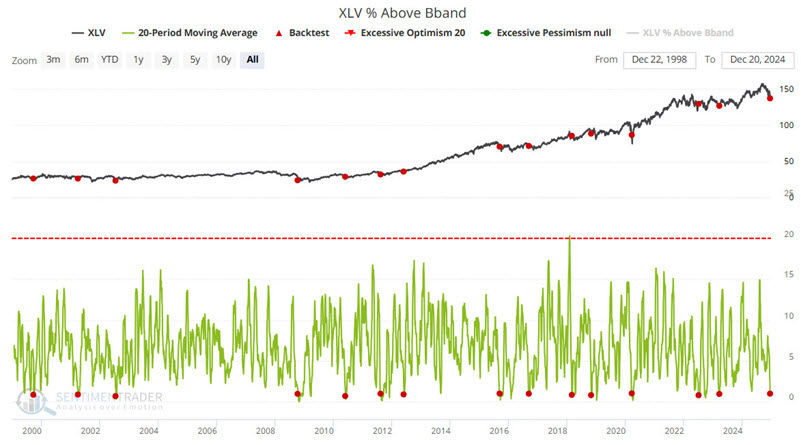
Our XLV Above Bband indicator shows the percentage of stocks in the named exchange-traded fund (ETF) that are currently trading above their upper Bollinger Band. This is a breadth figure to see the participation among fund members. Oftentimes, at turning points, the underlying breadth will diverge positively (at the bottom) or negatively (at the top) from the index. It is also helpful to monitor extremes in the breadth figures. When so many components of an index are doing well or poorly, we usually see the index make a counter move in the days, weeks, or months following the extreme.
The chart below highlights with a red dot each day when the 20-day moving average of the percentage of XLV constituent stocks above their respective upper Bollinger Band crossed below 1 for the first time in six months. The most recent signal occurred on 2024-12-18.
The table below displays signal-by-signal results for all signals since 1998.
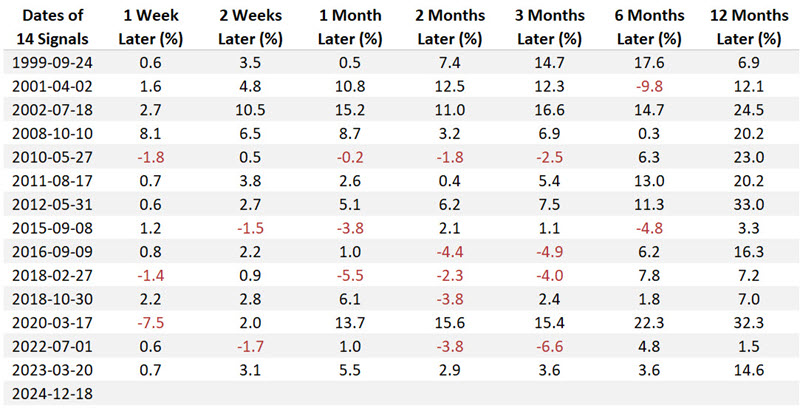
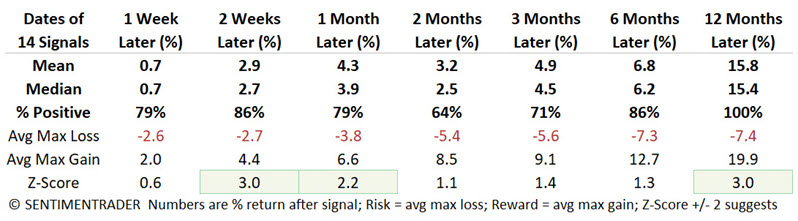
The table below summarizes XLV performance following the signals highlighted above.
Healthcare sentiment is reaching an extreme
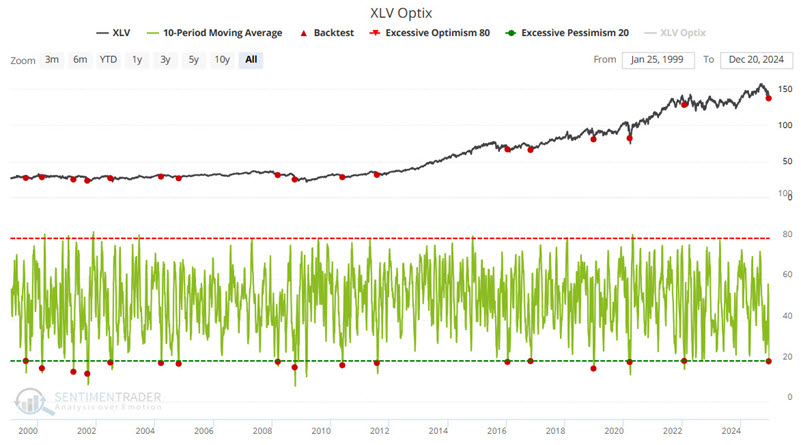
Our XLV Optix indicator recently touched an extreme level. While this is not an automatic buy signal, it tends to suggest better days ahead. The chart below highlights with a red dot each day when the 10-day moving for our XLV Optix indicator crossed below 20% for the first time in six months. The most recent signal occurred on 2024-12-18.
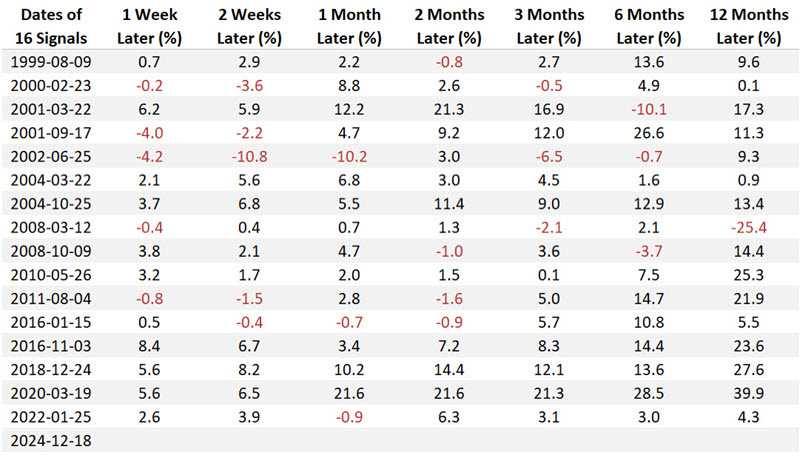
The table below displays signal-by-signal results for all signals since 1998.
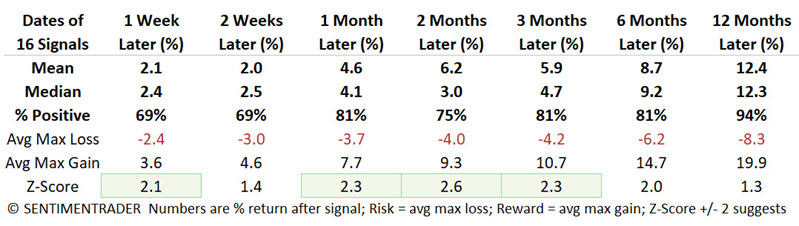
The table below summarizes XLV performance following the signals highlighted above.
The healthcare sector breadth has also reached an extreme
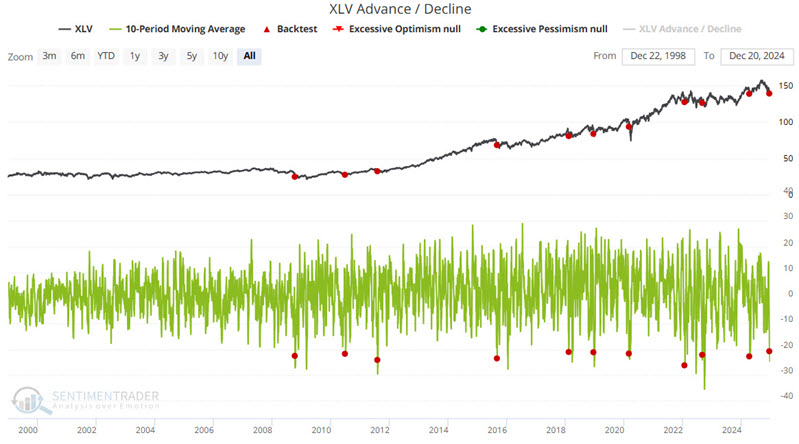
Our XLV Advance/Decline indicator shows the number of stocks in the named exchange-traded fund (ETF) that advanced minus declined on the day. This is a breadth figure to see the participation among index constituent stocks. Oftentimes, at turning points, the underlying breadth will diverge positively (at the bottom) or negatively (at the top) from the index. It is also helpful to monitor extremes in the breadth figures. When so many components of an index are doing well or poorly, we usually see the index make a counter move in the days, weeks, or months following the extreme.
The chart below highlights with a red dot each day when the 10-day moving average of the XLV Advance/Decline indicator crossed below -20 for the first time in six months. The most recent signal occurred on 2024-12-16.
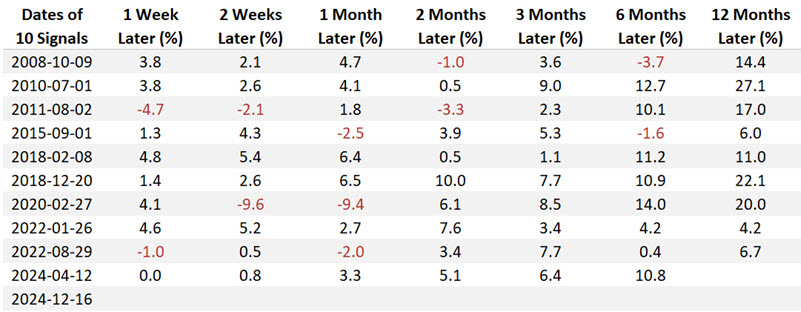
The table below displays signal-by-signal results for all signals since 1998.
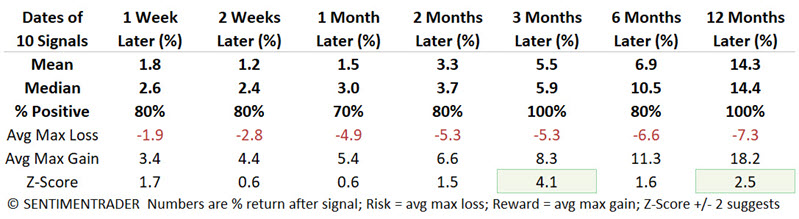
The table below summarizes XLV performance following the signals highlighted above.
XLV Panic/Breadth Composite starting to show signs of investor panic
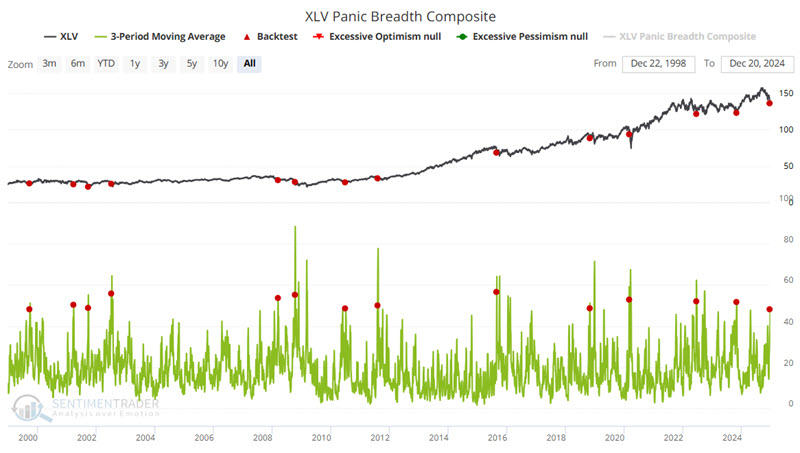
Our Panic Breadth Composite indicator offers a unique perspective on market sentiment and breadth analysis, providing traders and investors with valuable insights into overall market health. It leverages a straightforward yet insightful formula, aggregating various market metrics to gauge market participation breadth.
The Panic Breadth Composite provides a comprehensive snapshot of market sentiment and potential panic-driven behaviors by amalgamating these metrics and normalizing them into a composite score. This composite index, divided by 8 for normalization purposes, offers a nuanced perspective on market dynamics, serving as a valuable tool for assessing market breadth and identifying potential inflection points.
The chart below highlights with a red dot each day when the 10-day moving average of the XLV Panic/Breadth Composite indicator crossed above 38 for the first time in six months. The most recent signal occurred on 2024-12-19.
The table below displays signal-by-signal results for all signals since 1998.
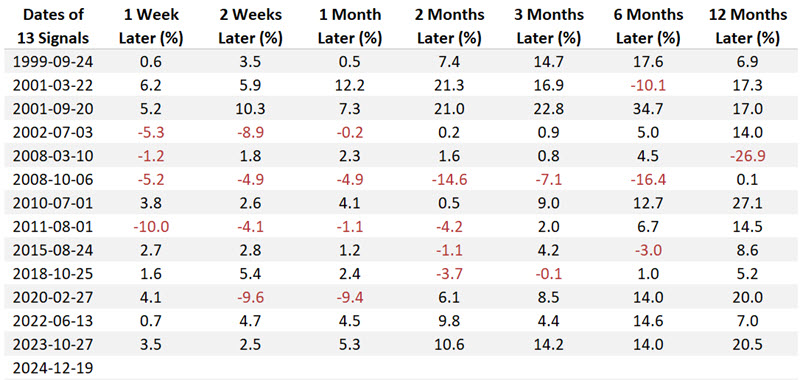
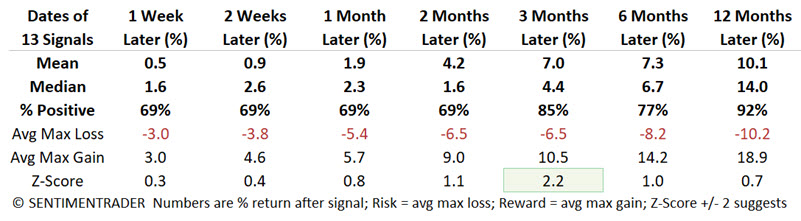
The table below summarizes XLV performance following the signals highlighted above.
What the research tells us…
The good news is that various typically reliable indicators suggest higher prices for the healthcare sector in the year ahead. The bad news is that the sector is most decidedly not in an uptrend right now. And therein lies the danger, as no one can predict for sure when the current downtrend will end, and the next meaningful bullish trend will emerge. The best action for most investors at this point is to open their minds to the potential opportunity forming in this sector and start thinking about what type of market/sector action would prompt them to commit new capital.