
Another look at a Strategy using SPY Optix
In a previous post, I took a look at building a basic strategy using the SPY Optimism Index (Optix).
In that post, the strategy I developed delivered the following results:
From Jan 1 2006 to July 8 2016, there were 33 total trades with a 72.73% win rate with a total profit of $58,570 on a $250,000 account (23.43% Return on Initial Capital) for a 2.16% annual rate of return. During this time, the strategy was in the market just over 40 days per trade on average and was in the market about 38% of the time.
I wanted to take another look at using the SPY Optix as a trading signal so I've built another similar strategy using a set hold time (in days) and using stops to protect any downside movement in the underlying.
The rules of this strategy are:
- Long only
- No Margin. Account size is $250K.
- 1,000 shares of SPY ETF
- Commission of $10 per trade
- $0.01 per share slippage
- Using a 5% stop
- Hold time of 20 days
- Go long when:
- SPY is above or equal to the 200 day simple moving average
- SPY Optix closes below 20 (Excessive Pessimism)
- Close when:
- SPY Optix closes above 80 (Excessive Optimism) OR
- SPY closes below stop OR
- Trade held for hold time (20 days)
- All orders are entered at the open of the next day’s trading session after a signal is given.
Using a set hold time and stops adds some additional value to the strategy. Using the exact same date range (Jan 1 2006 to July 8 2016) as before, this new strategy delivers an annual return of 2.8%, a 32.7% return on initial capital and drops the win-rate down to 69%.
Various trade statistics are provided below.
[caption id="attachment_874" align="aligncenter" width="383"]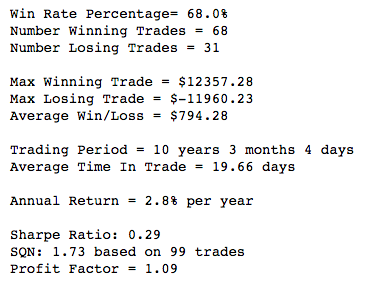 Figure 1: Strategy Statistics[/caption]
[caption id="attachment_876" align="aligncenter" width="282"]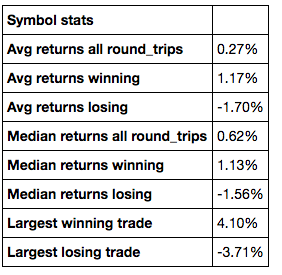 Figure 2: Strategy Win/Loss Statistics[/caption]
Adding hold time of 20 days and a stop of 5% adds value to the original strategy when compared to the same timeframes.
What does the strategy look like over the full range of data (Jan 1 2006 to October 7 2016)? It delivers an annual return of 2.91%, a 35.0% return on initial capital and a win-rate of 68%. Trade Statistics are provided below for reference.
[caption id="attachment_877" align="aligncenter" width="388"]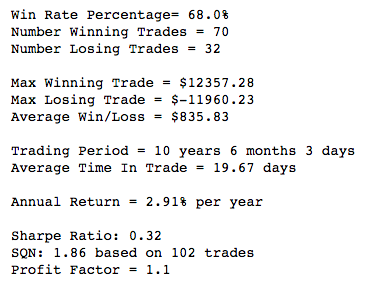 Figure 3: Strategy Statistics (Full-term)[/caption]
[caption id="attachment_878" align="aligncenter" width="303"]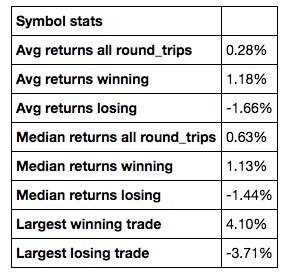 Figure 4: Strategy Win/Loss Statistics (Full-term)[/caption]
In addition to these basic statistics, I used Pyfolio to create a full tear sheet for this strategy to better understand the full view of performance with out-of-sample (2016) and in-sample data (2006 - 2015). Pyfolio allows a user to analyze returns and compare those returns against a benchmark, which in this case is a Buy and Hold strategy using SPY.
[caption id="attachment_879" align="aligncenter" width="600"]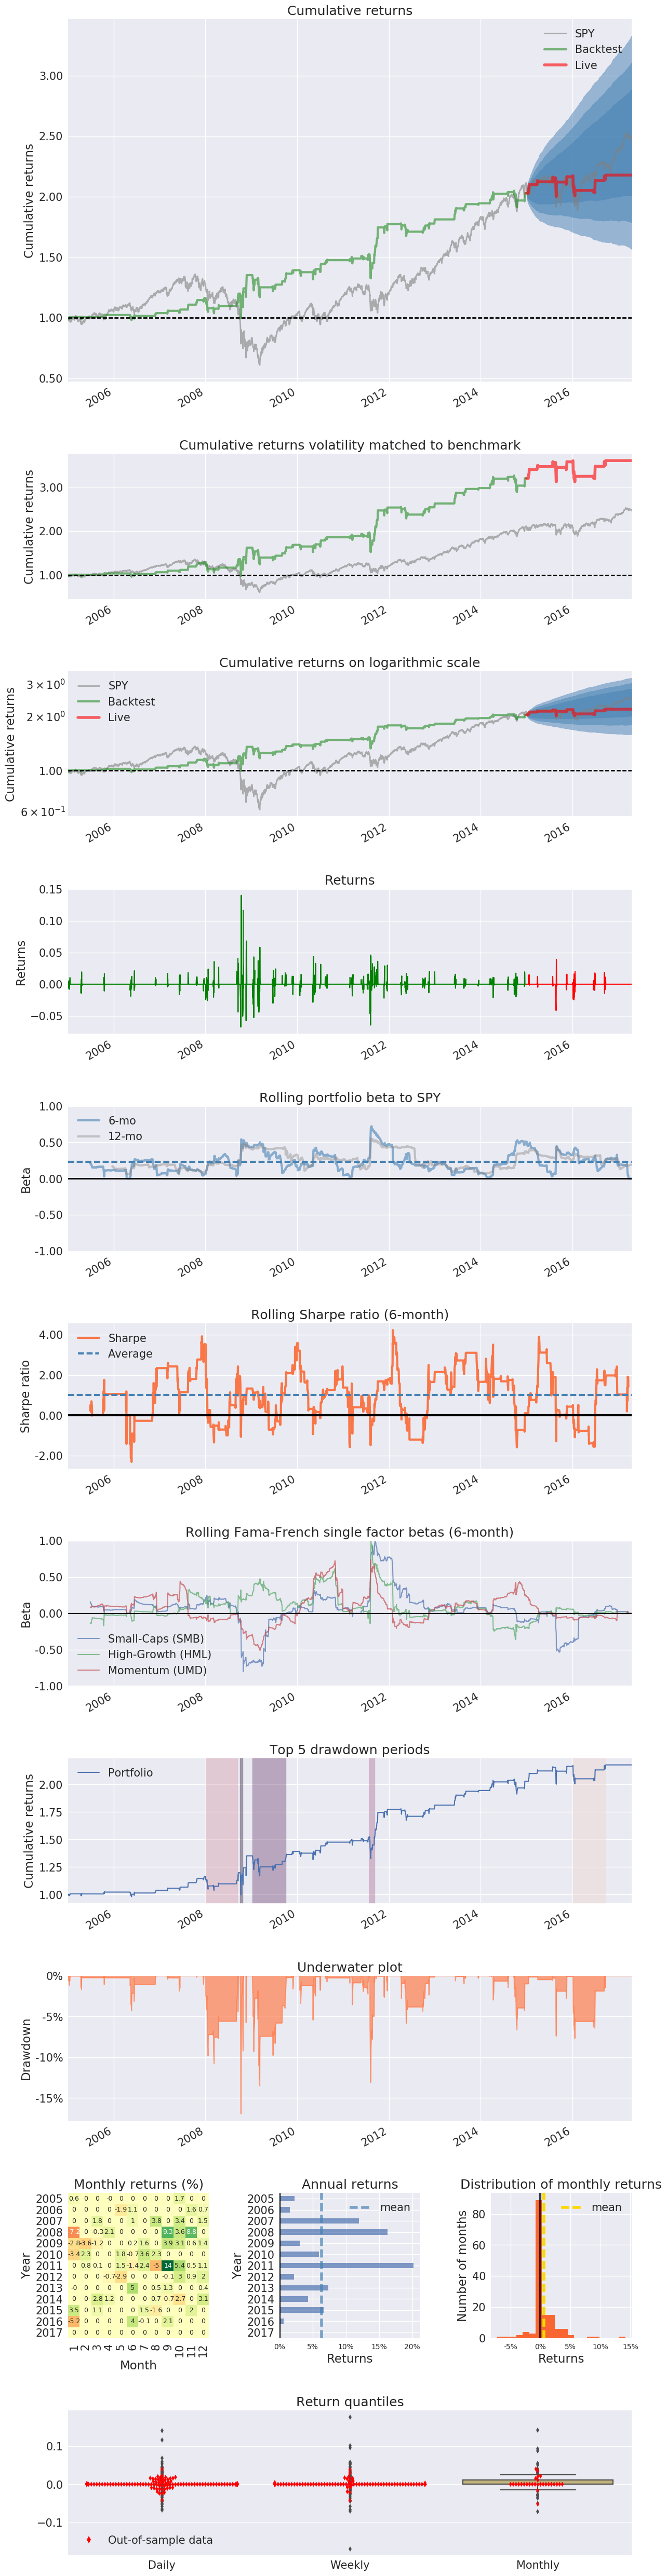 Figure 5: Tear Sheet Charts from Pyfolio[/caption]