
Another investor survey moves into favorable territory

Key points
- Not every indicator is meant to be used as a standalone trading system
- Many indicators are best used to add weight to the bullish or bearish case
- The NAAIM Exposure Index suggests that professional investors are becoming more bullish. The history of the index suggests that this is a good thing
Most indicators serve as a brick in the wall, not as a be-all, end-all
Too often, traders assume that each signal from a given indicator is a "call to action" - i.e., that it qualifies as a buy signal or a sell signal. But the reality is that most signals from most indicators are typically best used as the weight of the evidence for making a bullish or bearish case. In the past months, we have seen many indicators add weight to the bullish case for the stock market - see here, here, here, and here.
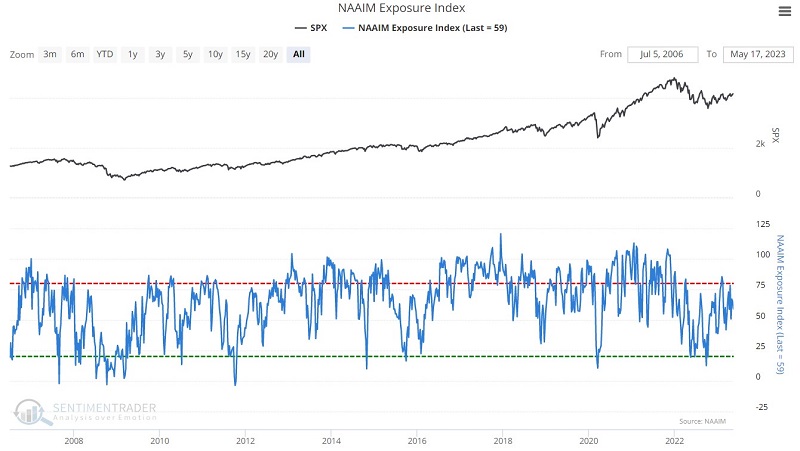
NAAIM Exposure Index
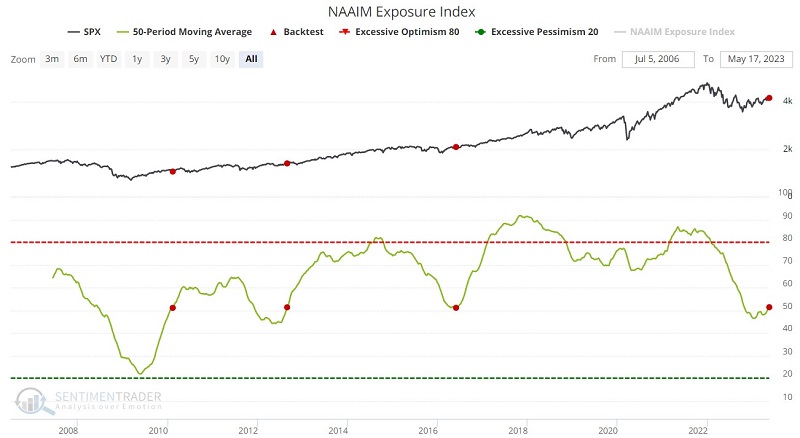
NAAIM stands for the National Association of Active Investment Managers. As the name implies, this is a group of professional investors. The chart below displays the weekly NAAIM Exposure Index readings.
From the website of the National Association of Active Investment Managers:
NAAIM member firms who are active money managers are asked each week to provide a number that represents their overall equity exposure at the market close on a specific day of the week, currently Wednesdays. Responses can vary widely, as indicated below. Responses are tallied and averaged to provide the average long (or short) position of all NAAIM managers as a group.
Range of Responses:
- 200% Leveraged Short
- 100% Fully Short
- 0% Cash or Hedged to Market Neutral
- 100% Fully Invested
- 200% Leveraged Long
Investment surveys typically serve as contrary indicators as investors tend to become more bullish as the market rises and more bearish as the market declines. As we will see, the NAAIM Exposure Index typically bucks this trend. While even professional money managers are susceptible to the pull of fear and greed, this group is more adept at fighting those emotions. This is highlighted by the fact that this group has tended to get it right at the extremes - albeit the sample sizes are too small to draw any definite conclusions.
When NAAIM members are extremely bullish
First, let's look at those times when the NAAIM Exposure Index was above 100% - i.e., the average position was fully long with some leverage - an extremely bullish stance. If this index were a contrary indicator, we would expect the market to perform poorly on average following such extreme bullishness. Instead, we find something completely different. The chart and table below highlight the performance of the S&P 500 following 100%+ readings from the NAAIM survey.
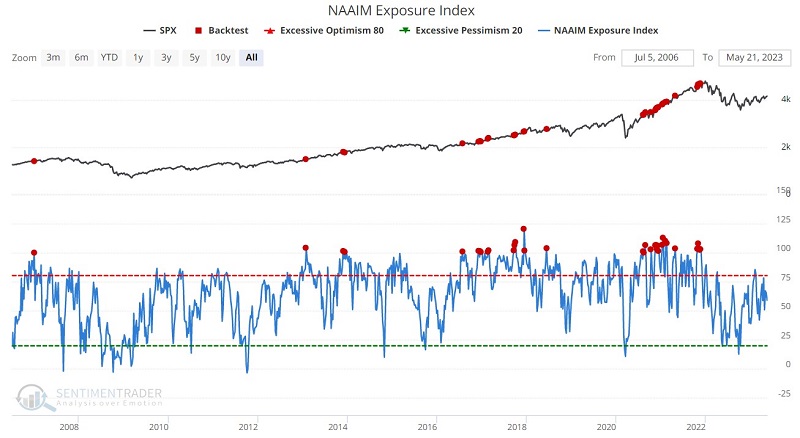
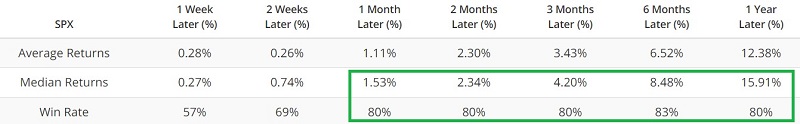
Note the Win Rate of 80%+ for 1-month to 12-month time frames.
When NAAIM members are extremely bearish
Now let's look at those times when the NAAIM Exposure Index was below 0% - i.e., the average position was actually short the stock market - an extremely bearish stance. Again, if this index were a contrary indicator, we would expect the market to perform well on average following such extreme bullishness. Instead, we find somewhat mixed results. The chart and table below highlight the performance of the S&P 500 following negative readings from the NAAIM survey.
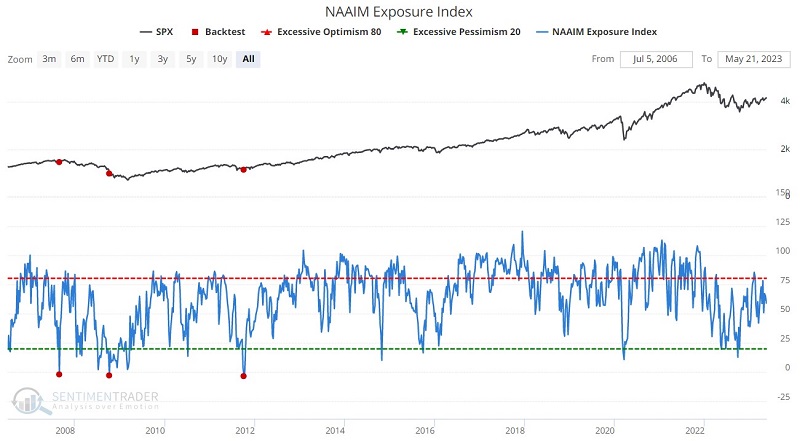
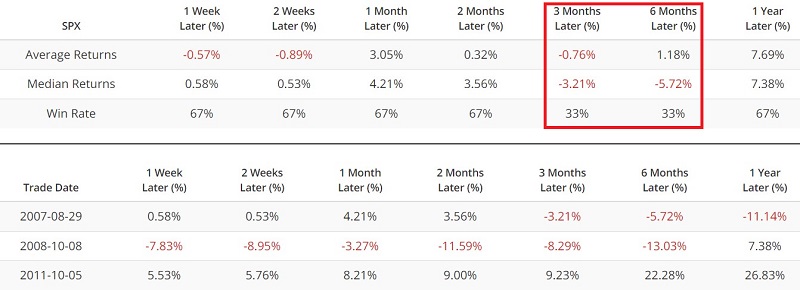
First, note that has only been three weeks when this happened - so the sample size is far too small to draw any conclusions from. Still, it is interesting to note that this group correctly flipped to the bearish side before the 2007-2008 market meltdown (in August 2007) and during the heat of it (October 2008). That said, the 2011 "signal" was just plain wrong.
One potentially helpful trend-following approach
As we saw above, sophisticated investors typically avoid an all-or-nothing approach (i.e., being either 100% in or 100% out of the market). Instead, many will scale the percentage allocation to stocks up or down based on perceived risk. The indicator below suggests that NAAIM members are pretty good at this. While any individual weekly reading can amount to "noise," the data becomes more valuable when we smooth it out. As the market weakens, members tend to reduce exposure to reduce risk. Members typically adjust quickly to increase exposure once the market appears to bottom and starts to rise. We follow a 50-week moving average of weekly readings to track this trend.
The chart and table below highlight those rare occasions when the NAAIM Exposure Index 50-week average crossed above 51%.
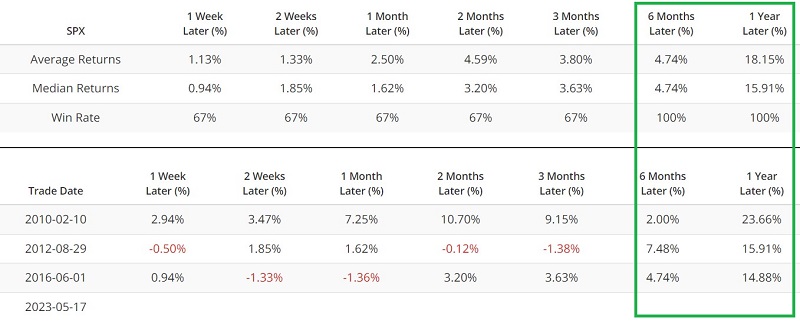
Once again, this is an exceedingly small sample size. But remember, we are looking at this indicator as "weight of the evidence" and not as an automatic buy or sell signal. The results have been helpful in the past as a weight of the evidence indicator. The average 12-month gain following a cross above 51% is 15.91%, with a 100% Win Rate. This is relevant as a new favorable signal (a cross above 51% by the 50-week average) occurred on 2023-05-17.
Does this guarantee that the stock market will move higher in the next 12 months? Not at all. It adds weight to the bullish case, as it suggests that a group of professional investors - who keep their collective finger firmly on the market's pulse - are seeing a better environment for stocks.
What the research tells us…
Like many indicators, the NAAIM Exposure Index is typically best used not as a standalone buy or sell signal but as part of a broader weight of the evidence approach. Still, when this group of investors acts in the extreme, it may be helpful to take note and follow their lead. Even more importantly, it appears to offer an important confirmation of an overall favorable stock market trend when they transition from being defensive to aggressive.