
Another correction marks the 4th in only 3 years

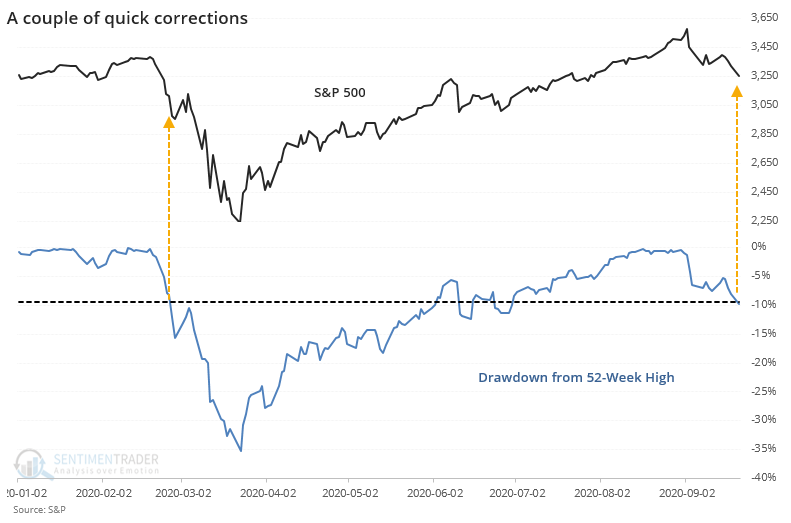
With further losses on Monday, we'll be hearing a lot about the S&P 500 falling into a correction. And then the catcalls about "actually, it's not really a correction..." It's a silly game of semantics that plays out every time in the age of clickbait social media.
We use the widely-accepted definition of a 10% decline from a 52-week as marking a correction. Of course, it's arbitrary. Everything about technical analysis is even though practitioners like to cite "rules." There are no rules when it comes to auction markets. Same goes for fundamental analysis for the most part.
It doesn't really matter. Let's not get hung up on useless word games and instead focus on the core of the matter, and that's whether fast pullbacks from an important peak are likely to continue to generate further selling pressure. For these purposes, we'll cheat a bit and consider any loss of 9.5% or greater (including on an intraday basis since 1962) to count as a correction.
If we can agree to that, then the S&P triggered it today.
The table below shows every date when the index fell this far from a 52-week high within 30 days of sitting at a 52-week high.
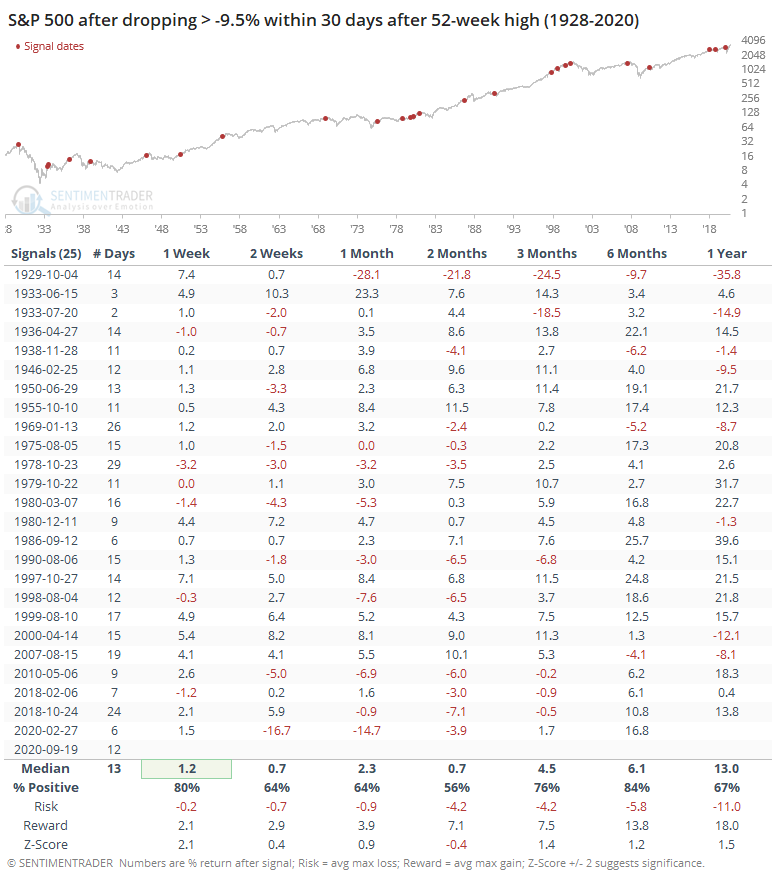
The last signal was a good warning sign that such eager selling pressure was just getting started. It also triggered in half the time, so there's that. Most of the others saw a rebound over the next week at least, but the 2-month time frame was sketchy. Risk increased substantially from shorter time frames, and the averages were unimpressive.
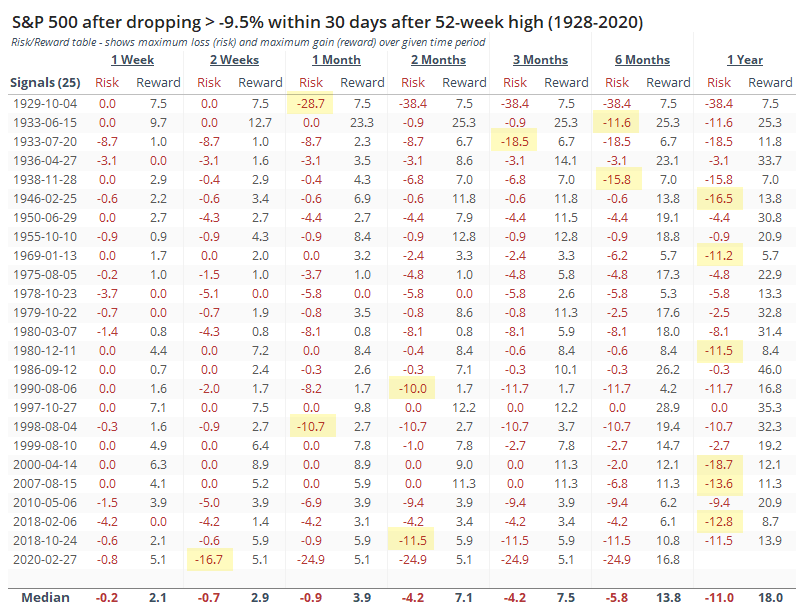
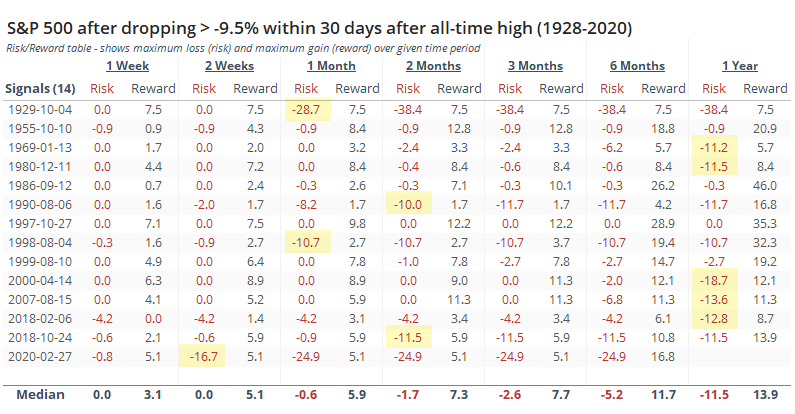
Below, we can see the Risk/Reward table. These show the S&P's maximum loss and maximum gain, respectively, from the signal date through each time frame. If the S&P fell a further 10% from the signal date, roughly pushing it into bear market territory, then it's highlighted in yellow. Out of the 25 signals, 14 of them did so within a year and 6 of them within 3 months. That would suggest about a 25% chance of falling into a bear market over the medium-term.
If we look at more important peaks, then we get the following.
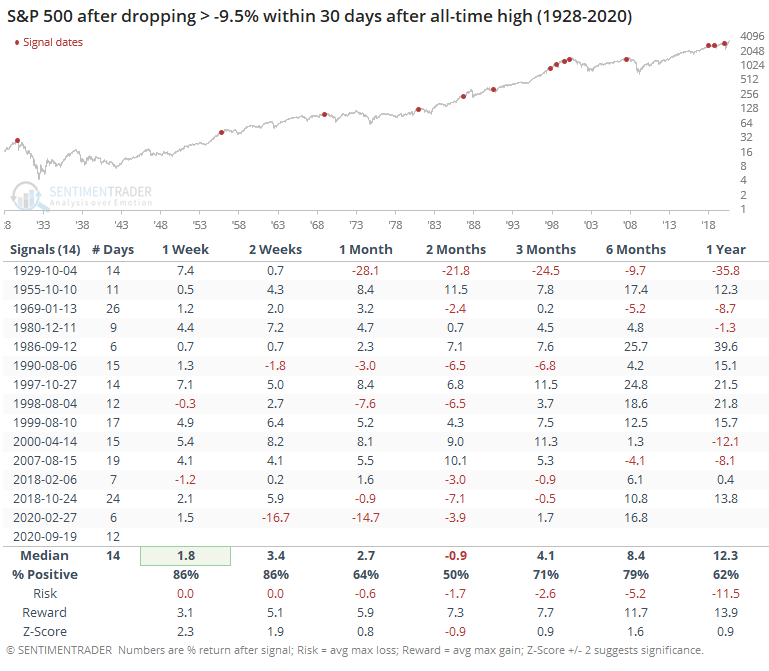
When the S&P dropped this much from an all-time high, it had even more of a tendency to see a short-term rebound, but also more of a tendency to see further selling pressure over the next couple of months. Risk was initially lower than after corrections from lesser peaks, so that's a point in bulls' favor over the medium-term.
Again, the Risk/Reward table for these signals is below. Out of 14 signals, 10 of them fell approximately into a bear market at some point within the next year, so not a great sign there. And 5 of them did so within 3 months, suggesting about a 1-in-3 chance of doing so now, based on this history.
We're now tied with 1977-1980 and 1997-2000 as having suffered 4 very quick corrections within a 3-year time span.
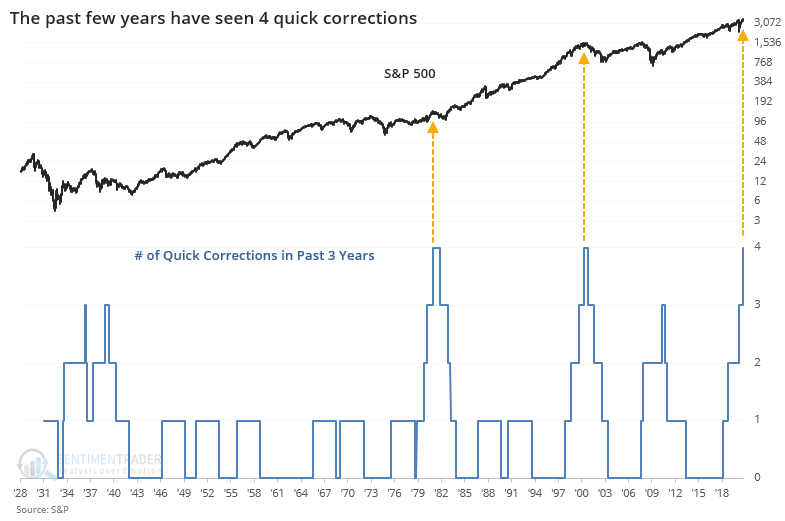
That's not very encouraging, since both saw stocks fall into a couple of years of malaise as investors tired of the volatility (there were many other factors contributing to both, to be sure).
There's something that bulls and bears might take from this behavior. Bulls could focus on the idea that there is less of a chance of falling into a bear market over the next few months. Bears may have a stronger argument, suggesting that at some point over the next year, the probability is relatively high of at least a further 10% decline. Plus, there's the idea that we've suffered so many of these in a relatively short investment horizon that it could contribute to a longer sense of risk aversion. Especially with all those recent call buyers registering all of the devastating losses they're currently suffering.
We'll have to keep an eye on the percentage of stocks within the S&P 500 that fall into a correction as well.
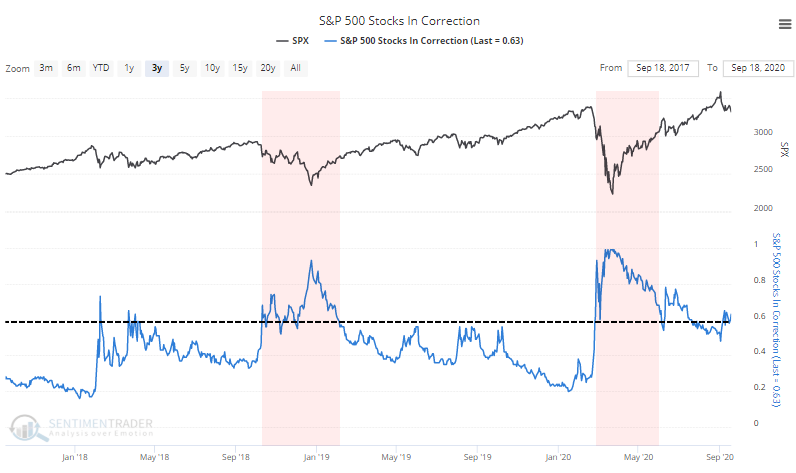
When this stays above 60%, which it's barely doing now, the market environment tends to be very volatile. Healthy markets might see brief bouts about this threshold but it rarely sticks for long.