Products
SentimenTrader Trading Tools
‍
Backtest Engine
My Trading Toolkit
Correlation Analysis
Seasonality
Market Prediction
Indicators & Data API
‍
Proprietary Indicators & Charts
Market Data API
Strategies & Scanner
‍
50+ Trading Strategies
Smart Stock Scanner
Smart Option Scanner
Research Reports
‍
Research Solutions
Reports Library
Free Resources
Simple Backtest Calculator
Simple Seasonality Calculator
The Kelly Criterion Calculator
Sentiment Geo Map
Public Research Reports
Education
Sentiment Indicators
Technical Indicators
Pricing
Company
About
In the News
Testimonials
Client Success Stories
Contact
Log inLoginSign up
< BACK TO ALL REPORTS

Another bear market price pattern signals caution

Dean Christians
2022-12-16
The S&P 500 reversed from a 42-day high to a 21-day low in 11 sessions. The price setback occurred within the context of an established long-term downtrend. After similar price patterns, the S&P 500 closed lower two months later in 70% of the historical cases.

Key points:

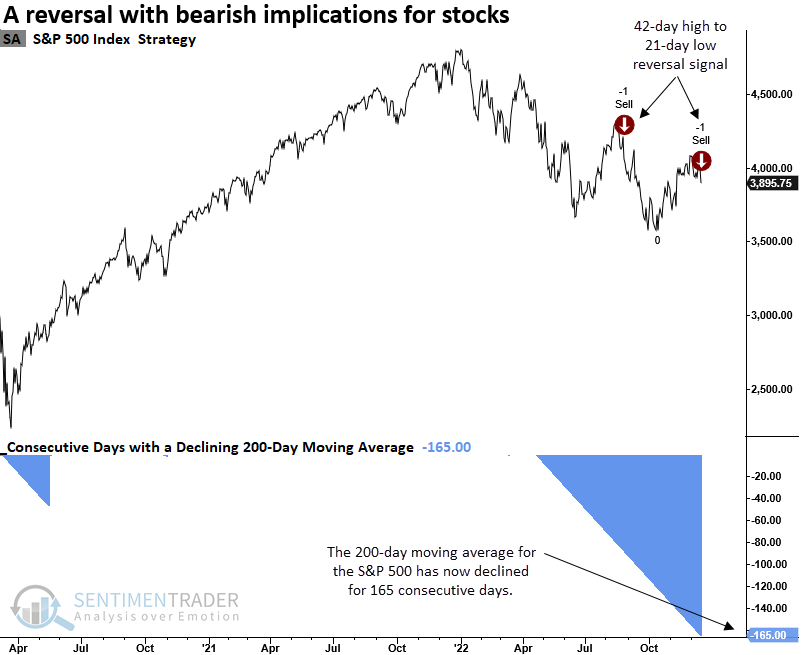
  • The S&P 500 swung from a 42-day high (close) to a 21-day low (close)
  • The reversal occurred in 11 sessions and within the context of a long-term downtrend
  • After similar patterns, the S&P 500 showed negative returns across almost all time frames

A bearish price pattern in an established downtrend

The world's most-watched benchmark reversed from a 42-day high (close) to a 21-day low (close) in only 11 sessions, triggering a bearish price pattern for the second time in four months. The last signal was unkind to equities, with the S&P 500 declining 10% over the next month.

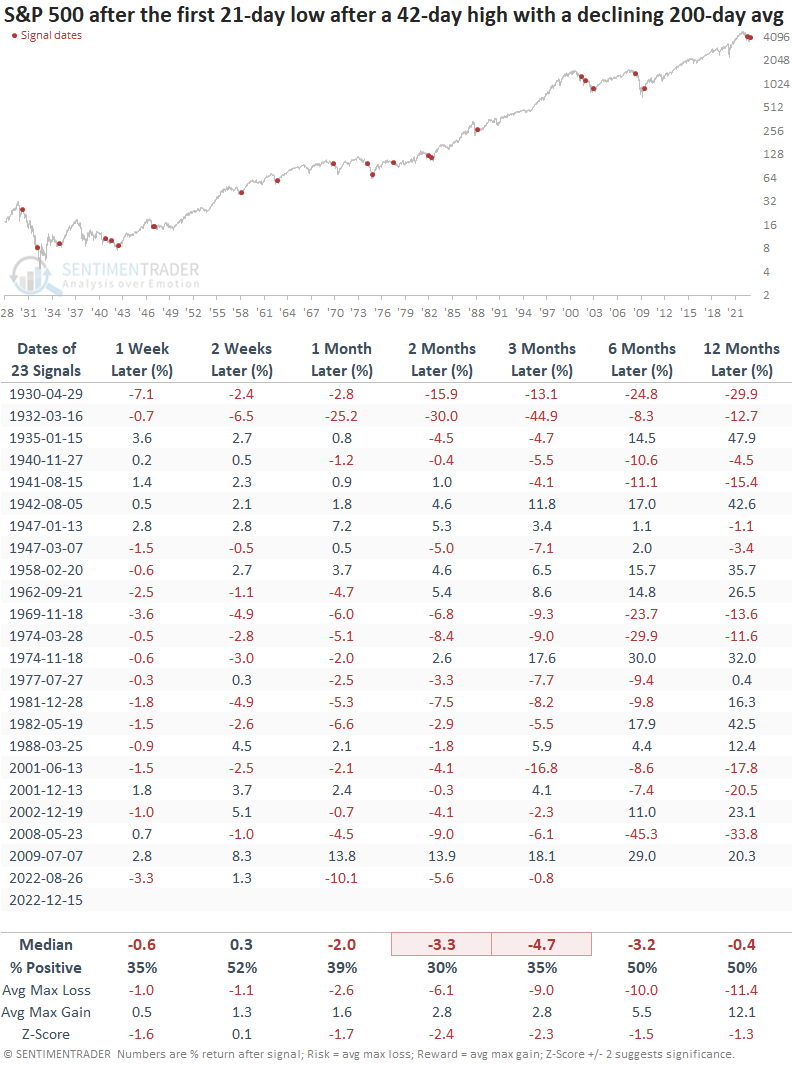
Let's assess the S&P 500 outlook when the index reverses from a 42-day high (close) to a 21-day low (close) in 15 or fewer sessions. At the same time, the index must be below its 200-day moving average, and the average has declined for at least 80 consecutive days. 

Similar bear market patterns preceded negative returns

A swift reversal from a 42-day high (close) to a 21-day low (close) in a downtrend does not bode well for the bull case. Historical precedents suggest we should keep an open mind to a resumption of the downtrend. Since 1969, the signal shows a loss at some point over the next two months in 13 out of 14 cases.

A historical comparison 

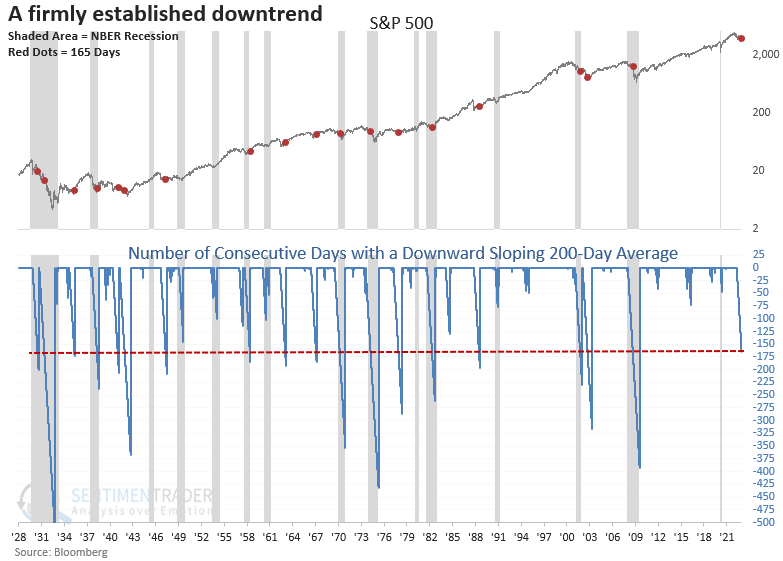
The 200-day moving average for the S&P 500 has now declined for 165 consecutive days, the 19th longest streak in history. Persistent long-term downtrends of this nature have occurred within the context of a recession in 8 out of 15 cases since 1928.

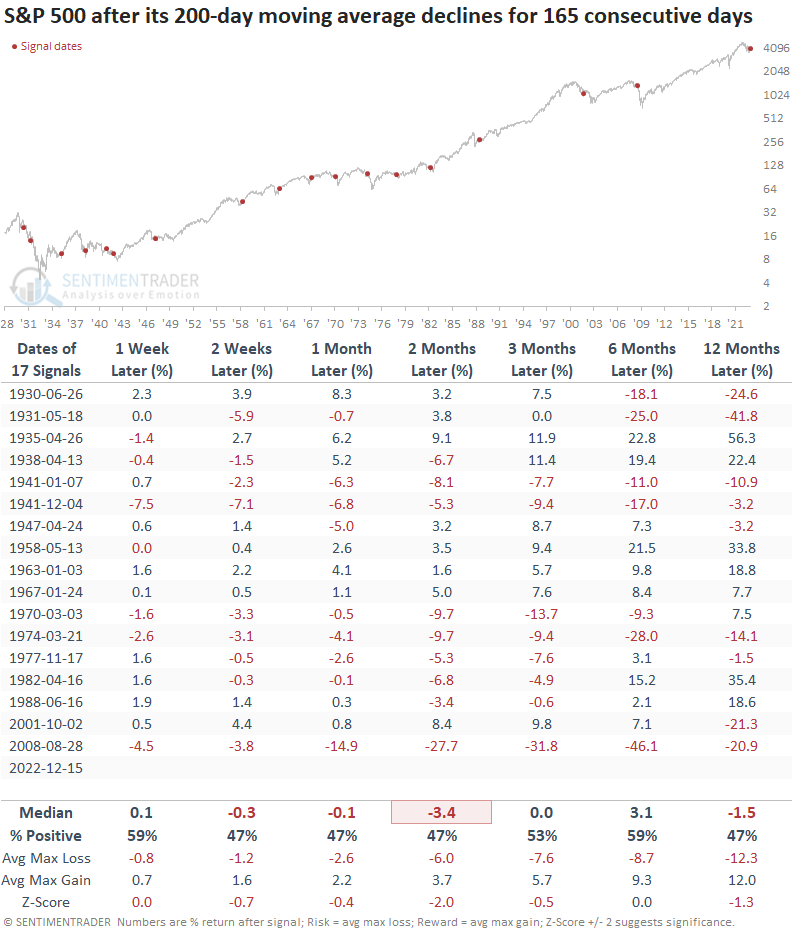
When the 200-day moving average declines for 165 consecutive days, stocks continue to struggle. Since 1970, the signal shows a loss at some point in the next two months in 6 out of 7 instances.

What the research tells us...

The emergence of an additional bearish price pattern after an impressive rally from the October low should remind us to keep an open mind to all market outcomes. One must consider a significant retracement or new low in equity indexes in the next few months as a real possibility. After swift reversals from a 42-day high (close) to a 21-day low (close) in an established downtrend, the S&P 500 closed lower two months later in 70% of the historical cases. The persistent decline in the 200-day moving average remains a headwind for stocks.

PRODUCTS
SentimenTrader
Trading Tools
Indicators & Data API
‍
Strategies & Scanner
‍
Research Reports
FREE
RESOUrCES
Simple Backtest
Calculator
Simple Seasonality
Calculator
The Kelly Criterion
Calculator
Sentiment Geo Map
‍
Public Research Reports
‍
Education
Sentiment Indicators
‍
Technical Indicators
‍
Pricing
Bundle pricing
‍
FAQ
‍
Announcements
‍
COMPANY
‍
About
‍
In the News
‍
Testimonials
‍
Client Success Stories
CONTACT
‍
General Inquiries
‍
Media Inquiries
‍
Financial Professionals Inquiries
‍
© 2026 Sundial Capital Research Inc. All rights reserved.
Setsail Marketing
TermsPrivacyAffiliate Program
Risk Disclosure: The information and tools provided are for research and analytical purposes only and are not intended as investment advice. Market analysis involves uncertainty, and outcomes may differ from expectations. Users should conduct their own due diligence and consider their individual circumstances before making any financial decisions. Past performance is not necessarily indicative of future results.

Hypothetical Performance Disclosure: Hypothetical performance results have many inherent limitations, some of which are described below. No representation is being made that any account will or is likely to achieve profits or losses similar to those shown; in fact, there are frequently sharp differences between hypothetical performance results and the actual results subsequently achieved by any particular trading program. One of the limitations of hypothetical performance results is that they are generally prepared with the benefit of hindsight. In addition, hypothetical trading does not involve financial risk, and no hypothetical trading record can completely account for the impact of financial risk of actual trading. for example, the ability to withstand losses or to adhere to a particular trading program in spite of trading losses are material points which can also adversely affect actual trading results. There are numerous other factors related to the markets in general or to the implementation of any specific trading program which cannot be fully accounted for in the preparation of hypothetical performance results and all which can adversely affect trading results.

Testimonial Disclosure: Testimonials appearing on this website may not be representative of other clients or customers and is not a guarantee of future performance or success.