Data &
Technology
Research
Reports
Report Solutions
Reports Library
Actionable
Strategies
Free
Resources
Simple Backtest Calculator
Simple Seasonality Calculator
The Kelly Criterion Calculator
Sentiment Geo Map
Public Research Reports
Free Webinar
Pricing
Company
About
Meet Our Team
In the News
Testimonials
Client Success Stories
Contact
Log inLoginSign up
< BACK TO ALL REPORTS

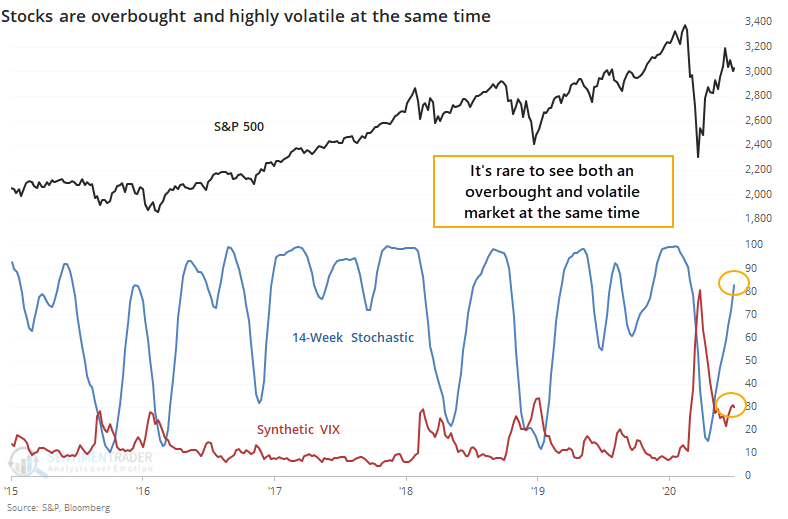
An overbought and volatile combination

Jason Goepfert
2020-06-30
By the end of last week, the S&P 500 hit an overbought reading according to the popular stochastic technical indicator. This is unusual because volatility was still high, with the VIX above 30. The combination of a high stochastic and high VIX has preceded gains in stocks over the next 6-12 months.

By the end of last week, the most benchmarked index in the world accomplished something it rarely does - it became overbought at the same time it was highly volatile.

Our good pal, and one of the most balanced strategists on Wall Street, Tony Dwyer from Canaccord Genuity noted to clients that when the 14-week stochastic indicator became overbought at the same time that the VIX was above 30, then it preceded positive returns over the next 6-12 months.

The reason this is unusual is that when an oscillator like the stochastic becomes overbought, it usually happens during calm markets, so the VIX tends to be low. If the VIX is high, then stocks have been volatile (almost always to the downside), so the stochastic is usually low.

Using the same process for creating a synthetic VIX index that we've used in the past, we can go back to 1962 and look for other times this might have happened. Like Tony mentioned, it has been a very good longer-term sign for stocks.

The table below shows times when a combination of the stochastic and VIX was above 120. The stochastic can't go above 100, so it means the VIX must be at least above 20. Usually, there was some combination of them both being relatively high. 

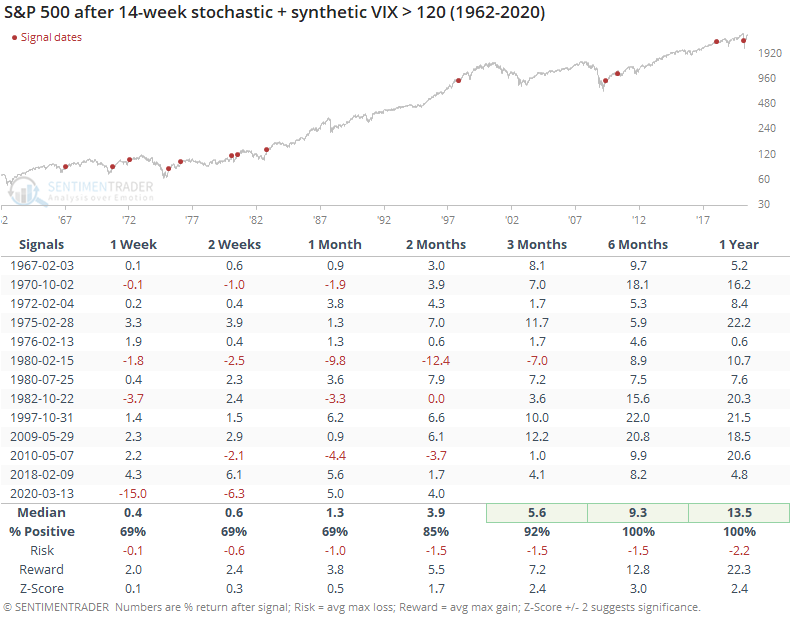
This typically triggered when stocks went through a severe, or at least fearful, decline, then jumped far and long enough for the stochastic to hit 80. While that preceded some shorter-term bumps a few times, the S&P was higher over the next 6-12 months every time.

The signal in March of this year is unusual because it was mostly due to the VIX being extremely high and the stochastic not being oversold yet. Maybe that will lessen the impact of the signal, which is the only reason we're not including this in the Active Studies.

Sorry, you don't have access to this report

Upgrade your subscription plan to get access
Go to Dasboard
DATA &
TECHnologies
IndicatorEdge
‍
BackTestEdge
‍
Other Tools
‍
DataEdge API
RESEARCH
reports
Research Solution
‍
Reports Library
‍
actionable
Strategies
Trading Strategies
‍
Smart Stock Scanner
‍
FREE
RESOUrCES
Simple Backtest
Calculator
Simple Seasonality
Calculator
The Kelly Criterion
Calculator
Sentiment Geo Map
‍
Public Research Reports
‍
Free Webinar
COMPANY
‍
About
‍
Meet our Team
‍
In the News
‍
Testimonials
‍
Client Success Stories
Pricing
Bundle pricing
‍
Announcements
‍
FAQ
© 2024 Sundial Capital Research Inc. All rights reserved.
Setsail Marketing
TermsPrivacyAffiliate Program
Risk Disclosure: Futures and forex trading contains substantial risk and is not for every investor. An investor could potentially lose all or more than the initial investment. Risk capital is money that can be lost without jeopardizing ones’ financial security or life style. Only risk capital should be used for trading and only those with sufficient risk capital should consider trading. Past performance is not necessarily indicative of future results.

Hypothetical Performance Disclosure: Hypothetical performance results have many inherent limitations, some of which are described below. No representation is being made that any account will or is likely to achieve profits or losses similar to those shown; in fact, there are frequently sharp differences between hypothetical performance results and the actual results subsequently achieved by any particular trading program. One of the limitations of hypothetical performance results is that they are generally prepared with the benefit of hindsight. In addition, hypothetical trading does not involve financial risk, and no hypothetical trading record can completely account for the impact of financial risk of actual trading. for example, the ability to withstand losses or to adhere to a particular trading program in spite of trading losses are material points which can also adversely affect actual trading results. There are numerous other factors related to the markets in general or to the implementation of any specific trading program which cannot be fully accounted for in the preparation of hypothetical performance results and all which can adversely affect trading results.

Testimonial Disclosure: Testimonials appearing on this website may not be representative of other clients or customers and is not a guarantee of future performance or success.