Products
SentimenTrader Trading Tools
‍
Backtest Engine
My Trading Toolkit
Correlation Analysis
Seasonality
Market Prediction
Indicators & Data API
‍
Proprietary Indicators & Charts
Market Data API
Strategies & Scanner
‍
50+ Trading Strategies
Smart Stock Scanner
Smart Option Scanner
Research Reports
‍
Research Solutions
Reports Library
Free Resources
Simple Backtest Calculator
Simple Seasonality Calculator
The Kelly Criterion Calculator
Sentiment Geo Map
Public Research Reports
Education
Sentiment Indicators
Technical Indicators
Pricing
Company
About
In the News
Testimonials
Client Success Stories
Contact
Log inLoginSign up
< BACK TO ALL REPORTS

An ominous price pattern or typical bull market behavior

Dean Christians
2023-06-27
The S&P 500 has stumbled over the last week, falling in 5 out of 6 sessions from a 1-year high. Similar price patterns tend to resolve themselves to the upside in short order. When the signal occurred with the S&P 500 below a 2-year high, the large-cap index was higher 93% of the time a year later.

Key points:

  • The S&P 500 declined in 5 out of 6 sessions after closing at a 1-year high
  • Similar price patterns led to positive returns in line with historical results over the next few months
  • When the signal occurred below a 2-year, the S&P 500 was higher 93% of the time a year later

A normal pullback or the start of something more ominous

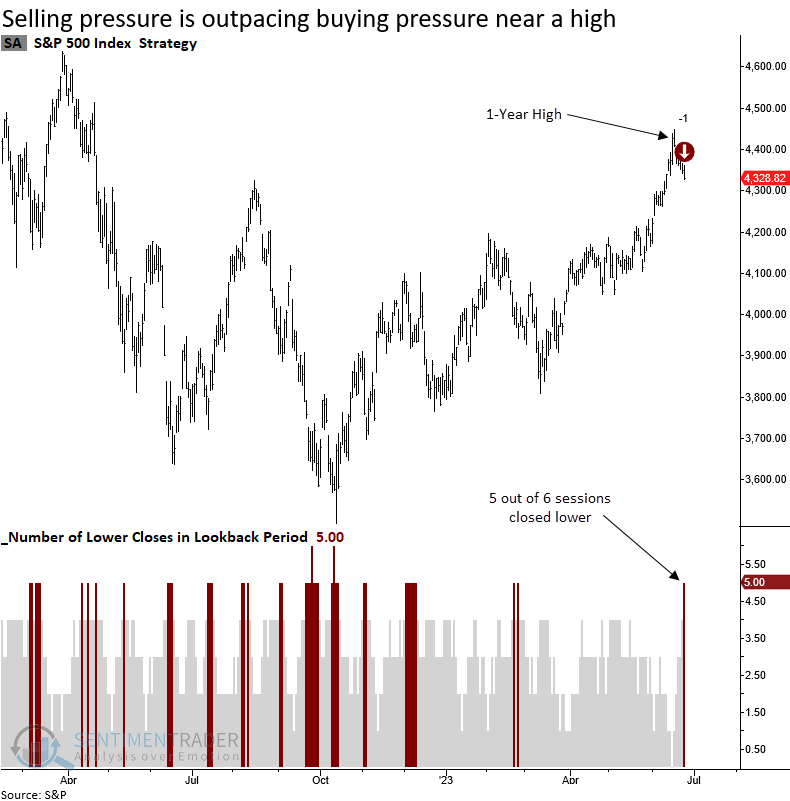
The S&P 500 has fallen in five out of the last six sessions after closing at a 1-year high on 2023-06-15. The natural assumption would be to infer that the selling pressure so soon after a high is an ominous sign for the market.

Let's assess whether we should follow the narrative or trust the data. 

Similar price patterns led to an upward bias in the S&P 500

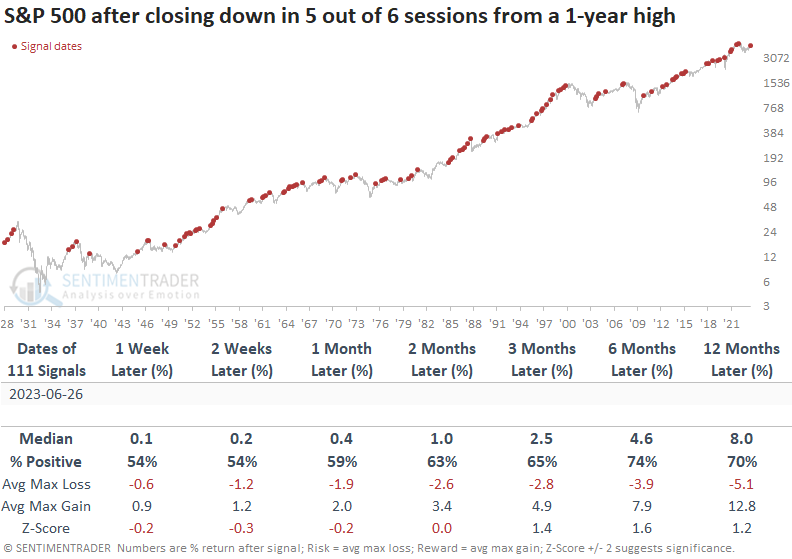
When the S&P 500 declines in 5 out of 6 sessions after closing at a 1-year, the large-cap index tends to perform in line with historical results for the next few months. From three to twelve months later, returns are slightly better than average.  

There were only 13 occasions out of 111 precedents where a maximum loss of -5% or more occurred within the next month, suggesting this is not the start of a more meaningful correction.

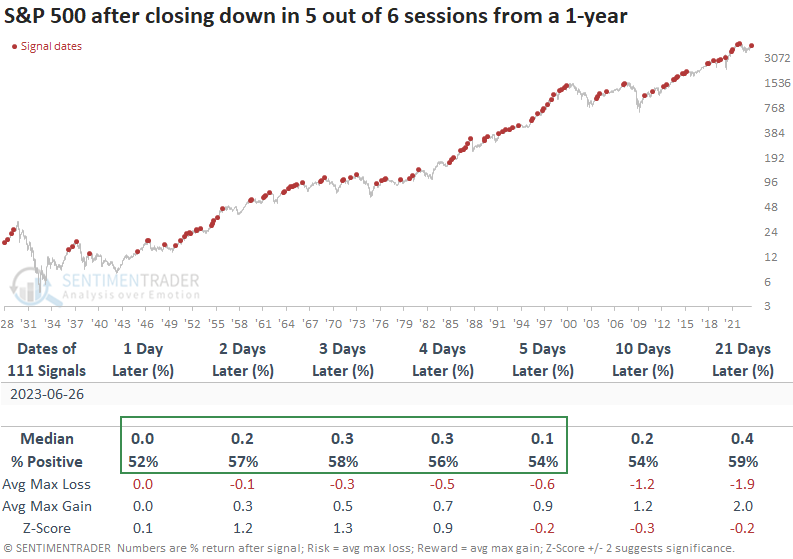
Applying the signals to an ultra-short-term outlook table shows a tendency for the market to bounce in the subsequent five sessions.

Additional context

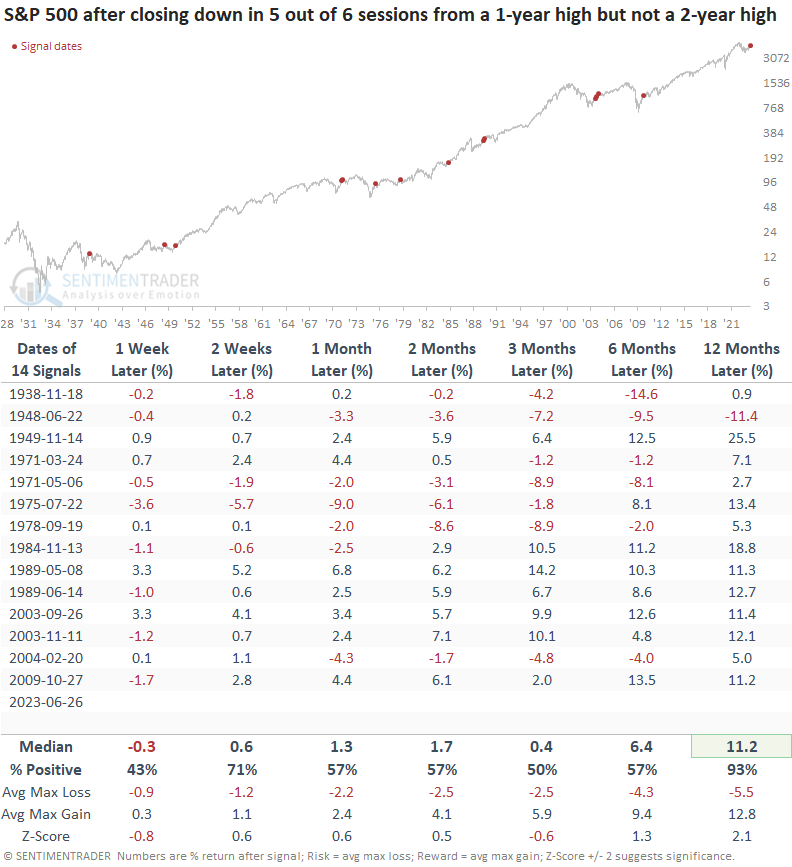
Suppose we include a new condition to the original study, specifically focusing on identifying signals when the S&P 500 remains below a 2-year high as it is currently. In that case, the S&P 500 struggled in the first week but tended to bounce back nicely the following week.

A year later, the index was higher in all but one case. 

What the research tells us...

The S&P 500 has fallen in 5 out of the last six sessions from a 1-year high. Similar price patterns suggest this is likely profit-taking commonly observed during bull markets and not the start of something more ominous. When the signal occurred with the S&P 500 below a 2-year high, the large-cap index was higher every time but once a year later.

PRODUCTS
SentimenTrader
Trading Tools
Indicators & Data API
‍
Strategies & Scanner
‍
Research Reports
FREE
RESOUrCES
Simple Backtest
Calculator
Simple Seasonality
Calculator
The Kelly Criterion
Calculator
Sentiment Geo Map
‍
Public Research Reports
‍
Education
Sentiment Indicators
‍
Technical Indicators
‍
Pricing
Bundle pricing
‍
FAQ
‍
Announcements
‍
COMPANY
‍
About
‍
In the News
‍
Testimonials
‍
Client Success Stories
CONTACT
‍
General Inquiries
‍
Media Inquiries
‍
Financial Professionals Inquiries
‍
© 2026 Sundial Capital Research Inc. All rights reserved.
Setsail Marketing
TermsPrivacyAffiliate Program
Risk Disclosure: The information and tools provided are for research and analytical purposes only and are not intended as investment advice. Market analysis involves uncertainty, and outcomes may differ from expectations. Users should conduct their own due diligence and consider their individual circumstances before making any financial decisions. Past performance is not necessarily indicative of future results.

Hypothetical Performance Disclosure: Hypothetical performance results have many inherent limitations, some of which are described below. No representation is being made that any account will or is likely to achieve profits or losses similar to those shown; in fact, there are frequently sharp differences between hypothetical performance results and the actual results subsequently achieved by any particular trading program. One of the limitations of hypothetical performance results is that they are generally prepared with the benefit of hindsight. In addition, hypothetical trading does not involve financial risk, and no hypothetical trading record can completely account for the impact of financial risk of actual trading. for example, the ability to withstand losses or to adhere to a particular trading program in spite of trading losses are material points which can also adversely affect actual trading results. There are numerous other factors related to the markets in general or to the implementation of any specific trading program which cannot be fully accounted for in the preparation of hypothetical performance results and all which can adversely affect trading results.

Testimonial Disclosure: Testimonials appearing on this website may not be representative of other clients or customers and is not a guarantee of future performance or success.