Data &
Technology
Research
Reports
Report Solutions
Reports Library
Actionable
Strategies
Free
Resources
Simple Backtest Calculator
Simple Seasonality Calculator
The Kelly Criterion Calculator
Sentiment Geo Map
Public Research Reports
Free Webinar
Pricing
Company
About
Meet Our Team
In the News
Testimonials
Client Success Stories
Contact
Log inLoginSign up
< BACK TO ALL REPORTS

An Obscure Buy Signal to Stir the Pot

Jay Kaeppel
2021-04-12
Some indicators can be quite obscure and/or may only give signals every once in a great while. Take this one for example.

Well as I see it, part of my job here at Sentimentrader is to find the stuff that you are either too busy - or not quite as far out in the weeds as I am - to uncover.

Take this one, for example.

As I will detail in a moment, an entirely obscure momentum buy signal flashed at the end of March 2021. For the record, this is the first signal it has generated in 25 years, which makes it easy to miss - not to mention easy to dismiss.  

Still, historically this signal has tended to highlight bullish moves of up to 4 years. Which is a little uncomfortable at the moment given the:

  • non-stop nature of the rally in the last year - and the gains seen since the 2009 low
  • historically high P/E ratio (Shiller PE currently north of 37)
  • vast array of overly speculative activity we have seen in the last 6-12 months (much of which has been highlighted in great abundance by Jason)

But mine is not to question why - mine is to show you what I've found.

So here goes...

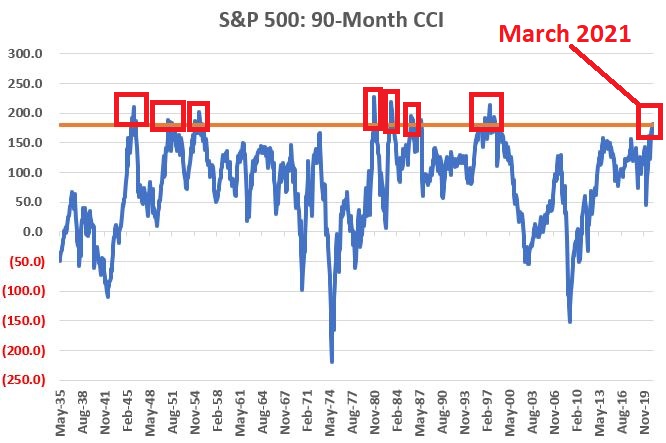
The S&P Long-Term CCI Buy Signal

The CCI (mercifully shortened from Commodity Channel Index) is a fairly commonly used technical analysis tool. However, not many people use it as described below:

  • If the 90-month CCI (Yes, 90 months!!!) CCI for the S&P 500 Index tops 180, a 48-month buy signal occurs

For testing purposes:

  • when the 90-month CCI ends a month above 180, we will categorize the next 48 months as bullish
  • we will ignore any new signals that occur within 24 months of a previous initial 48-month bullish period

The chart below shows each of the previous buy signals from this indicator.  Prior to March of 2021 there have been only 7 previous signals in the past 76 years.  A small sample size to be sure.  

The table below displays the few signals that have occurred and the cumulative price return for the S&P 500 Index over the subsequent 48 months.

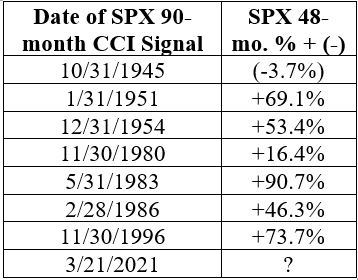
For the record the median 48-month return:

  • for ALL 48-month rolling periods starting in 1940 is +38.1%
  • the median 48-month return for the signals listed above is+53.4%

The chart below displays the cumulative price gain for the S&P 500 Index if held for 48 months after the dates listed in the table above.  

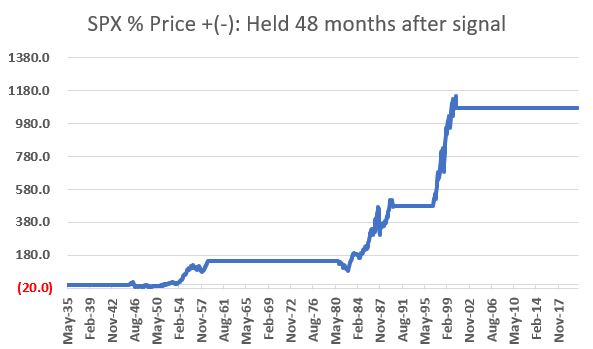
Not perfect, not without volatility and dips, but also pretty solidly LLUR (Lower left to upper right) and somewhat compelling.

Why is this relevant? Because this indicator gave a new signal at the end of March 2021. The implication - in theory anyway - is that the next four years should be favorable for the stock market. Is anyone willing to make that bet?

I told you it was a little uncomfortable.

Sorry, you don't have access to this report

Upgrade your subscription plan to get access
Go to Dasboard
DATA &
TECHnologies
IndicatorEdge
‍
BackTestEdge
‍
Other Tools
‍
DataEdge API
RESEARCH
reports
Research Solution
‍
Reports Library
‍
actionable
Strategies
Trading Strategies
‍
Smart Stock Scanner
‍
FREE
RESOUrCES
Simple Backtest
Calculator
Simple Seasonality
Calculator
The Kelly Criterion
Calculator
Sentiment Geo Map
‍
Public Research Reports
‍
Free Webinar
COMPANY
‍
About
‍
Meet our Team
‍
In the News
‍
Testimonials
‍
Client Success Stories
Pricing
Bundle pricing
‍
Announcements
‍
FAQ
© 2024 Sundial Capital Research Inc. All rights reserved.
Setsail Marketing
TermsPrivacyAffiliate Program
Risk Disclosure: Futures and forex trading contains substantial risk and is not for every investor. An investor could potentially lose all or more than the initial investment. Risk capital is money that can be lost without jeopardizing ones’ financial security or life style. Only risk capital should be used for trading and only those with sufficient risk capital should consider trading. Past performance is not necessarily indicative of future results.

Hypothetical Performance Disclosure: Hypothetical performance results have many inherent limitations, some of which are described below. No representation is being made that any account will or is likely to achieve profits or losses similar to those shown; in fact, there are frequently sharp differences between hypothetical performance results and the actual results subsequently achieved by any particular trading program. One of the limitations of hypothetical performance results is that they are generally prepared with the benefit of hindsight. In addition, hypothetical trading does not involve financial risk, and no hypothetical trading record can completely account for the impact of financial risk of actual trading. for example, the ability to withstand losses or to adhere to a particular trading program in spite of trading losses are material points which can also adversely affect actual trading results. There are numerous other factors related to the markets in general or to the implementation of any specific trading program which cannot be fully accounted for in the preparation of hypothetical performance results and all which can adversely affect trading results.

Testimonial Disclosure: Testimonials appearing on this website may not be representative of other clients or customers and is not a guarantee of future performance or success.