Data &
Technology
Research
Reports
Report Solutions
Reports Library
Actionable
Strategies
Free
Resources
Simple Backtest Calculator
Simple Seasonality Calculator
The Kelly Criterion Calculator
Sentiment Geo Map
Public Research Reports
Free Webinar
Pricing
Company
About
Meet Our Team
In the News
Testimonials
Client Success Stories
Contact
Log inLoginSign up
< BACK TO ALL REPORTS

An extreme of extremes

Jason Goepfert
2020-12-01
The percentage of indicators showing excessive optimism has reached a 15-year high.

Last week, options traders returned to their speculative ways. Traders large and small plunged into call options, buying them at a pace twice as great as put options.

Options activity is but one of the many extremes that our indicators are showing. So many, in fact, that an average of more than 55% of the core indicators have been in extreme territory over the past week.

Percentage of indicators showing optimism

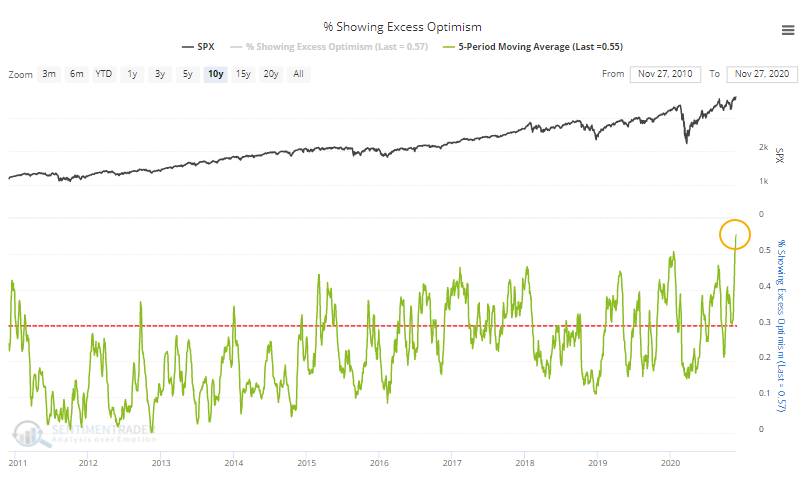
Spread out over a week, this is the most extremes we've seen among our indicators in 15 years. Other times we've seen more than 50% become extreme, stocks have had a tough time holding their upside momentum.


What else is happening

These are topics we explored in our most recent research. For immediate access with no obligation, sign up for a 30-day free trial now.

  • A rundown of options activity last week, including some extremes not seen in 20 years
  • What happens when Fear & Greed tilts heavily to the "greed" side
  • The S&P 500 gained more than 10% in November
  • The Russell 2000's single-month gain and what that bodes for the broader market
  • The VIX is dipping below 21 for the 1st time in months
  • Optimism on gold dropped to its lowest level in a year
  • What happens when the copper / gold ratio cycles from a 2-year low to a 1-year high

Stat Box

The VIX "fear gauge" closed below 21 last week for the first time in more than 100 days. It has ended similar streaks only 6 times in the past 30 years, and all 6 of those ended up leading to gains in stocks over the ensuing 6 months.

Sentiment from other perspectives

We don't necessarily agree with everything posted here - some of our work might directly contradict it - but it's often worth knowing what others are watching.

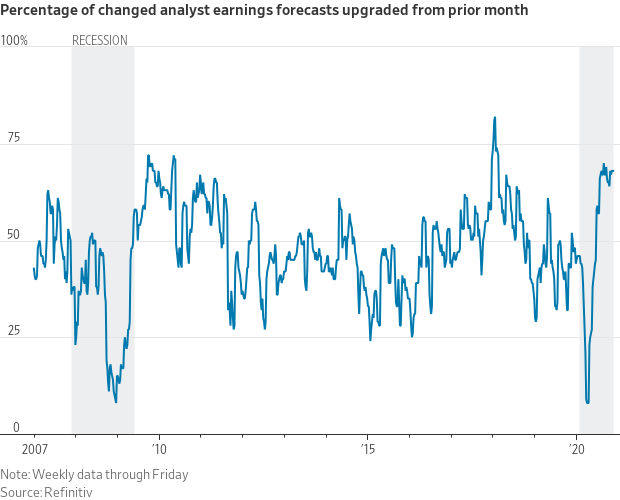
1. More than 70% of Wall Street forecast changes have been to the upside. Analysts do NOT like being left behind in a bull market. [WSJ]

wall street analyst earnings forecast changes

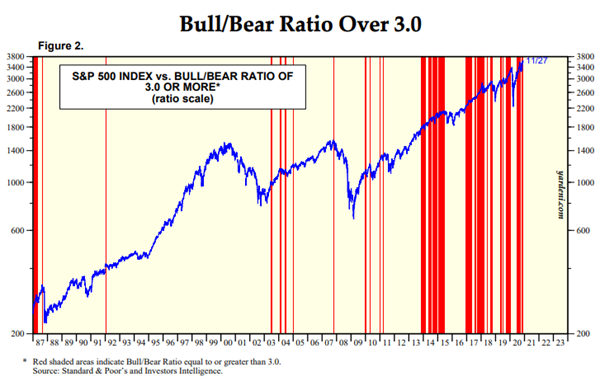
2. Newsletters are nearing maximum optimism, too. The ratio of bulls to bears is back over 3.0, a level that has often led to a plateauting of gains for stocks. [Yardeni]

investor's intelligence bull bear ratio

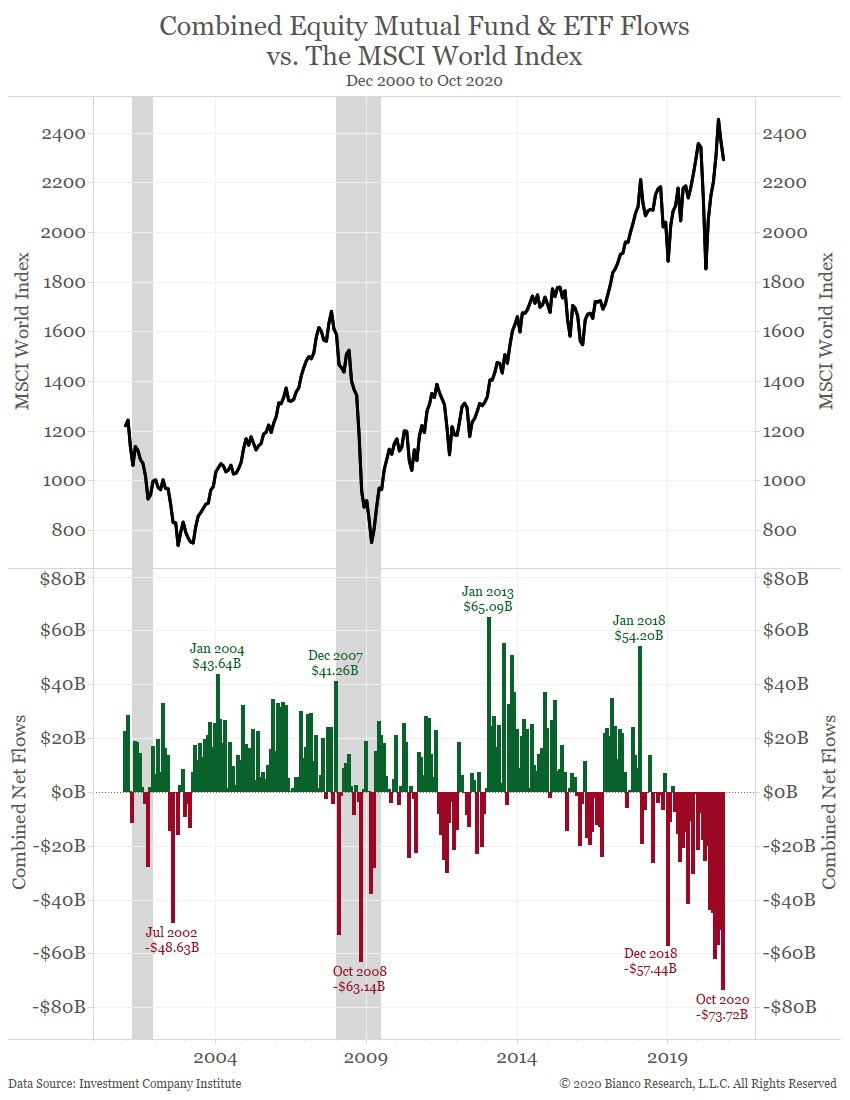
3. And yet...and yet. Equity funds continue to bleed assets. It doesn't seem to make sense, but there are ways to buy stocks other than through a fund structure. [Bianco Research]

equity fund flows

DATA &
TECHnologies
IndicatorEdge
‍
BackTestEdge
‍
Other Tools
‍
DataEdge API
RESEARCH
reports
Research Solution
‍
Reports Library
‍
actionable
Strategies
Trading Strategies
‍
Smart Stock Scanner
‍
FREE
RESOUrCES
Simple Backtest
Calculator
Simple Seasonality
Calculator
The Kelly Criterion
Calculator
Sentiment Geo Map
‍
Public Research Reports
‍
Free Webinar
COMPANY
‍
About
‍
Meet our Team
‍
In the News
‍
Testimonials
‍
Client Success Stories
Pricing
Bundle pricing
‍
Announcements
‍
FAQ
© 2024 Sundial Capital Research Inc. All rights reserved.
Setsail Marketing
TermsPrivacyAffiliate Program
Risk Disclosure: Futures and forex trading contains substantial risk and is not for every investor. An investor could potentially lose all or more than the initial investment. Risk capital is money that can be lost without jeopardizing ones’ financial security or life style. Only risk capital should be used for trading and only those with sufficient risk capital should consider trading. Past performance is not necessarily indicative of future results.

Hypothetical Performance Disclosure: Hypothetical performance results have many inherent limitations, some of which are described below. No representation is being made that any account will or is likely to achieve profits or losses similar to those shown; in fact, there are frequently sharp differences between hypothetical performance results and the actual results subsequently achieved by any particular trading program. One of the limitations of hypothetical performance results is that they are generally prepared with the benefit of hindsight. In addition, hypothetical trading does not involve financial risk, and no hypothetical trading record can completely account for the impact of financial risk of actual trading. for example, the ability to withstand losses or to adhere to a particular trading program in spite of trading losses are material points which can also adversely affect actual trading results. There are numerous other factors related to the markets in general or to the implementation of any specific trading program which cannot be fully accounted for in the preparation of hypothetical performance results and all which can adversely affect trading results.

Testimonial Disclosure: Testimonials appearing on this website may not be representative of other clients or customers and is not a guarantee of future performance or success.